Symas Corp., June 2014
This selection of engines is interesting because they're all closely related in one way or another: obviously the LevelDB databases are all of a breed, all using Log Structured Merge (LSM) trees as their main data store. LMDB and BerkeleyDB are both Btree engines. WiredTiger comes from the people who created BerkeleyDB, and it offers both LSM and Btree engines. Both LMDB and TokuDB's APIs are based on the BerkeleyDB API. TokuDB is unique here, being the only engine implementing Fractal Trees. (And since Fractal Trees are patented, they will probably remain the sole implementation for some time to come...)
The RocksDB test focuses on multithreaded read performance for a purely in-memory database. As such, none of the tests shown here involve any disk I/O and the data sets are chosen to ensure they fit entirely in the test machine's RAM.
Tests were conducted on two different test environments - one an Asus NP56D laptop with 16GB of RAM and quad core AMD A10-4600M APU, and an HP DL585 G5 server with 128GB of RAM and 4 quad core AMD Opteron 8354 CPUs.
Note: as with the microbench reports we published earlier, we did not design the test scenarios. The LevelDB authors designed the original microbench scenario, and the RocksDB authors designed this one. We have received criticism for running tests that are artificially biased to show LMDB in its best light. Such statements are nonsense; we didn't design the tests. If you have issues with how the tests were designed, take it up with the LevelDB or RocksDB authors, respectively.
1. Footprint
One of the primary reasons to use an embedded database is because one needs
something lightweight with a small application footprint. Here's how the programs
in this test stack up, using identical driver code and with their DB libraries
statically linked into the binaries to show the full DB code size. (Note that this
still fails to take into account other system libraries that some engines use
that others don't. E.g., Basho and RocksDB also require librt, the realtime
support library.) We've also listed each projects' size in lines of source code,
as reported by Ohloh.net.
size db_bench* text data bss dec hex filename Lines of Code 285306 1516 352 287174 461c6 db_bench
39758
384206 9304 3488 396998 60ec6 db_bench_basho
26577 1688853 2416 312 1691581 19cfbd db_bench_bdb
1746106 315491 1596 360 317447 4d807 db_bench_hyper
21498 121412 1644 320 123376 1e1f0 db_bench_mdb
7955 1014534 2912 6688 1024134 fa086 db_bench_rocksdb
81169 992334 3720 30352 1026406 fa966 db_bench_tokudb
227698 853216 2100 1920 857236 d1494 db_bench_wiredtiger
91410
LMDB is still the smallest by far.
2. Small Data Set
Using the laptop we generate a database with 20 million records. The records have
16 byte keys and 100 byte values so the resulting database should be about 2.2GB
in size. After the data is loaded a "readwhilewriting" test is run using 4 reader
threads and one writer. All of the threads operate on randomly selected records
in the database. The writer performs updates to existing records; no records are
added or deleted so the DB size should not change much during the test.
The tests in this section and in Section 3 are all run on a tmpfs, just like the RocksDB report. I.e., all of the data is stored only in RAM. Additional tests using an SSD follow in Section 4.
The pertinent results are tabulated here and expanded on in the following sections.
| Engine | Load Time | Overhead | Load Size | Writes/Sec | Reads/Sec | Run Time | Final Size | CPU% | Process Size | ||||
|---|---|---|---|---|---|---|---|---|---|---|---|---|---|
| Wall | User | Sys | KB | Wall | User | Sys | KB | KB | |||||
| LevelDB | 00:34.70 | 00:44.72 | 00:06.70 | 1.4818443804 | 2246004 | 10232 | 26678 | 00:49:58.73 | 01:31:48.62 | 00:52:50.95 | 3452388 | 289% | 2138508 |
| Basho | 00:40.41 | 01:24.39 | 00:17.82 | 2.5293244246 | 2368768 | 10232 | 68418 | 00:19:32.94 | 01:14:10.04 | 00:01:19.19 | 2612436 | 386% | 6775376 |
| BerkeleyDB | 02:12.61 | 01:58.92 | 00:13.57 | 0.9990950909 | 5844376 | 9565 | 86202 | 00:15:28.44 | 00:42:07.97 | 00:17:27.49 | 5839912 | 385% | 3040716 |
| Hyper | 00:38.78 | 00:49.88 | 00:06.43 | 1.4520371325 | 2246448 | 10208 | 138393 | 00:09:38.39 | 00:35:06.12 | 00:02:06.18 | 2292632 | 385% | 2700088 |
| LMDB | 00:10.55 | 00:08.15 | 00:02.37 | 0.9971563981 | 2516192 | 10224 | 1449709 | 00:00:55.46 | 00:03:37.63 | 00:00:01.67 | 2547968 | 395% | 2550408 |
| RocksDB | 00:21.54 | 00:34.70 | 00:05.99 | 1.8890436397 | 2256032 | 10233 | 91544 | 00:14:37.74 | 00:54:06.84 | 00:02:38.04 | 3181764 | 387% | 6713852 |
| TokuDB | 01:45.12 | 01:41.58 | 00:47.37 | 1.4169520548 | 2726168 | 9881 | 109682 | 00:12:12.91 | 00:37:41.45 | 00:07:10.03 | 3920784 | 367% | 5429056 |
| WiredLSM | 01:10.93 | 02:35.55 | 00:18.62 | 2.4555195263 | 2492440 | 10230 | 179617 | 00:07:26.24 | 00:28:55.85 | 00:00:07.76 | 2948988 | 390% | 3205396 |
| WiredBtree | 00:17.79 | 00:15.68 | 00:02.09 | 0.9988757729 | 2381876 | 10021 | 752078 | 00:01:53.46 | 00:06:36.98 | 00:00:14.78 | 4752568 | 362% | 3415468 |
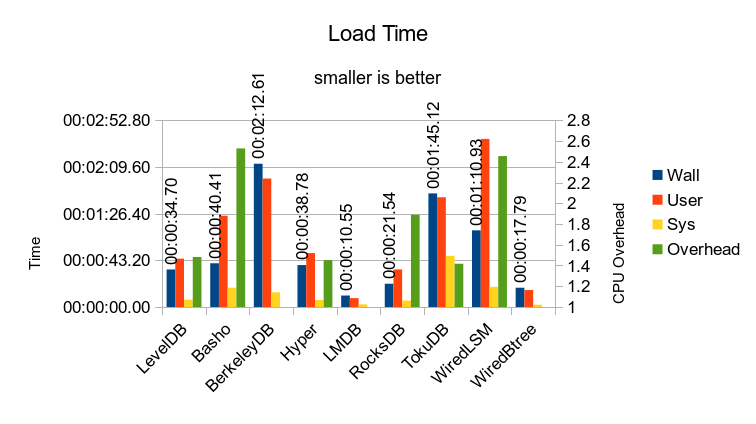
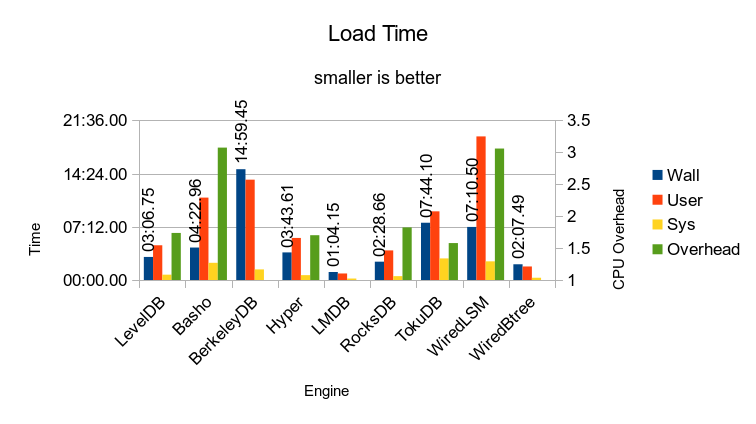
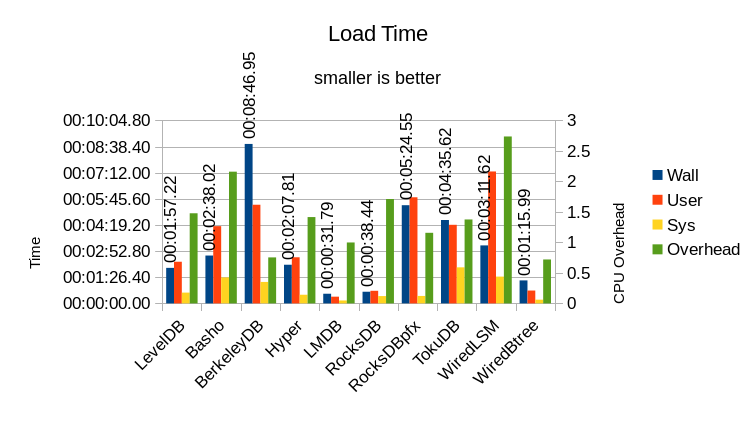
The "Overhead" column is the ratio of adding the User and System time together, then dividing by the Wall time. It is measured against the right-side Y-axis on this graph. This shows how much work of the DB load occurred in background threads. Ideally this value should be 1, all foreground and no background work. When a DB engine relies heavily on background processing to achieve its throughput, it will bog down more noticeably when the system gets busy. I.e., if the system is already busy doing work on behalf of users, there will not be any idle system resources available for background processing.
Here the 3 Btree engines all have an Overhead of 1.0 - they require no background processing to perform the data load. In contrast, all of the LSM engines require significant amounts of processing to perform ongoing compaction of their data.
This graph shows the load performance as throughput over time:
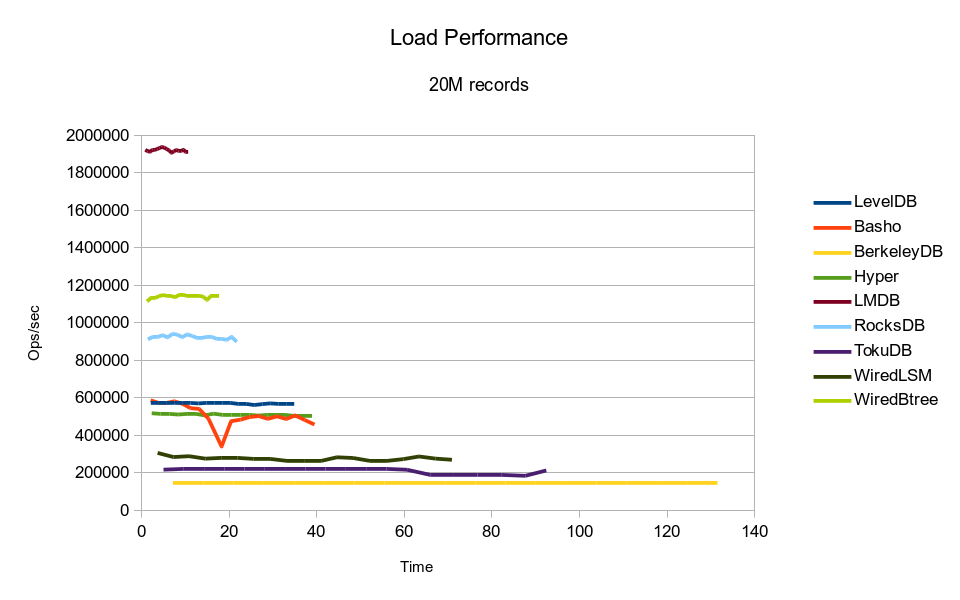
It makes the difference in performance between the DB engines much more obvious.
BerkeleyDB clearly adheres to the "slow and steady" principle; its throughput
is basically constant. Basho shows wildly erratic throughput. The others are
all fairly consistent at this small data volume.
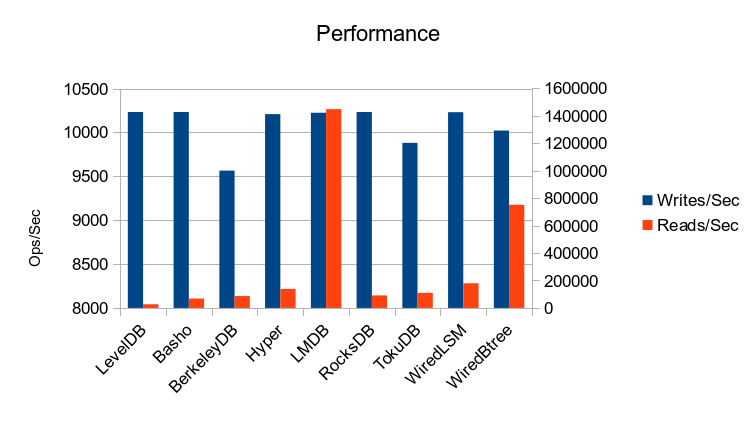
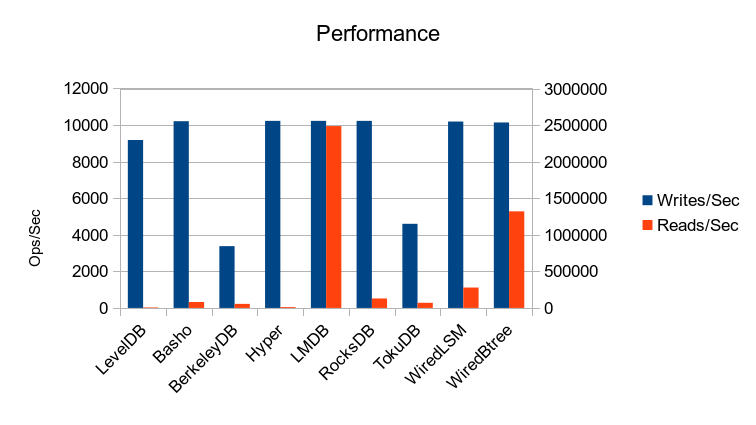
The WiredTiger Btree gives an impressive read throughput, giving it a solid second place in the results. None of the other engines are even within an order of magnitude of LMDB's read performance. Graphs with a detailed breakdown of the per-thread throughput are available on the Details page.
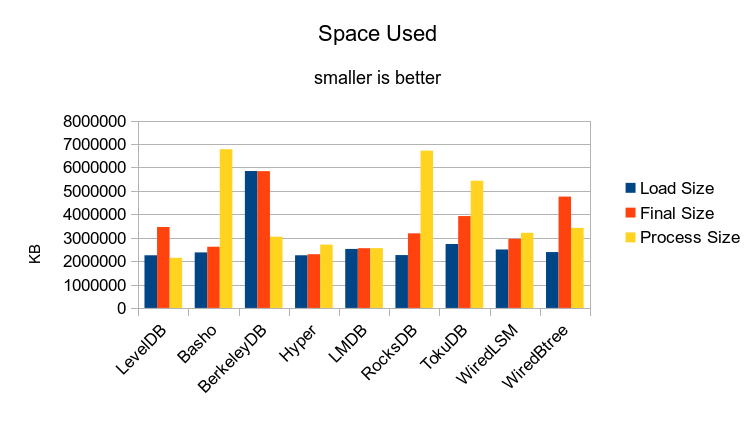
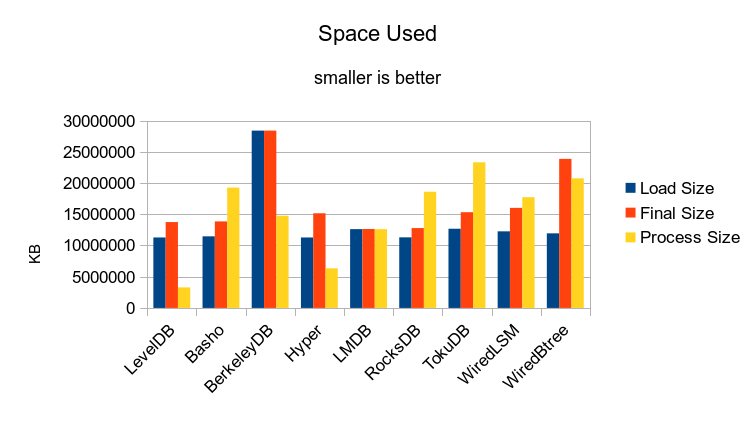
Most of the DB engines (except LMDB) have significant space overhead, and unfortunately this graph doesn't even capture the full scope of this overhead - during the run various log files will be growing and being truncated, so the actual space used may be even larger than shown here.
LMDB uses no log files - the space reported here is all the space that it uses.
The Process Size shows the maximum size the test program grew to while running the test. This is another major concern when trying to determine how much system capacity is needed to support a given workload. In this case, all of the engines (except LMDB) require memory for application caching. They were all set to run with 6GB of cache. Both Basho and RocksDB would have used more memory if available; in an earlier run with the cache set to 8GB they both grew past 9GB and caused the machine to start swapping. While most people believe "more cache is better" the fact is that trying to use too much will hurt performance. As always, it takes careful testing and observation to choose a workable cache size for a given workload.
It's not clear to me why any DB engine would need more than 6GB of memory to
manage 2GB of actual data. With LMDB's Single-Level-Store, cache size is a
non-issue and the engine can never drive a system into swapping. There's
no wasted overhead - all of the memory in the system gets applied to your
actual application, so you can get more work done with any given hardware
configuration than any other database.
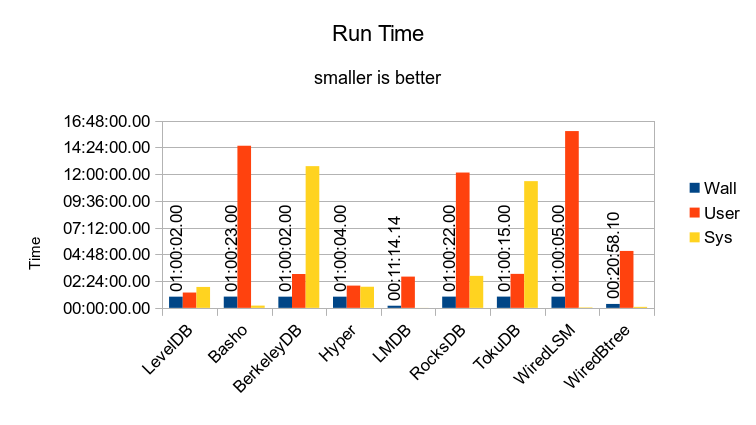
3. Larger Data Set
These tests use 100 million records and are run on the 16 core server.
Aside from the data set size things are much the same. Here are the tabular results:
| Engine | Load Time | Overhead | Load Size | Writes/Sec | Reads/Sec | Run Time | Final Size | CPU% | Process Size | ||||
|---|---|---|---|---|---|---|---|---|---|---|---|---|---|
| Wall | User | Sys | KB | Wall | User | Sys | KB | KB | |||||
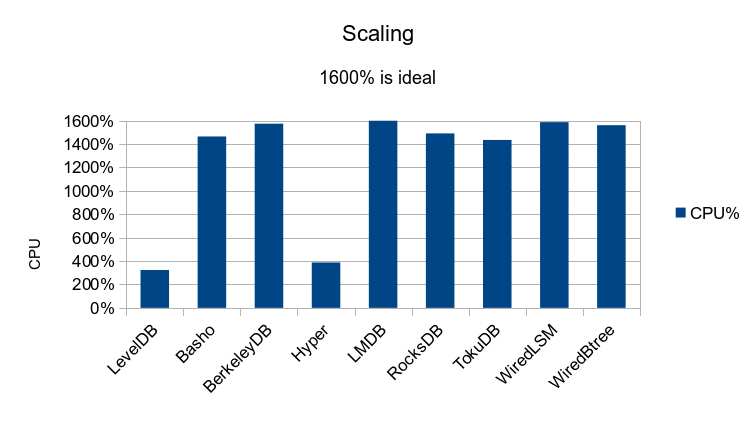
| LevelDB | 03:06.75 | 04:41.26 | 00:42.87 | 1.7356358768 | 11273396 | 9184 | 7594 | 01:00:02.00 | 01:22:11.46 | 01:52:10.46 | 13734168 | 323% | 3284192 |
| Basho | 04:22.96 | 11:09.24 | 02:18.93 | 3.0733571646 | 11449492 | 10211 | 80135 | 01:00:23.00 | 14:32:23.67 | 00:11:49.40 | 13841220 | 1464% | 19257796 |
| BerkeleyDB | 14:59.45 | 13:34.30 | 01:25.15 | 1 | 28381956 | 3378 | 55066 | 01:00:02.00 | 03:02:00.69 | 12:42:39.63 | 28387880 | 1573% | 14756768 |
| Hyper | 03:43.61 | 05:41.14 | 00:39.02 | 1.7001028577 | 11280092 | 10231 | 11673 | 01:00:04.00 | 01:59:42.09 | 01:53:24.27 | 15149416 | 387% | 6332460 |
| LMDB | 01:04.15 | 00:52.31 | 00:11.82 | 0.9996882307 | 12605332 | 10230 | 2486800 | 00:11:14.14 | 02:47:58.57 | 00:00:10.06 | 12627692 | 1598% | 12605788 |
| RocksDB | 02:28.66 | 03:59.92 | 00:30.97 | 1.8222117584 | 11289688 | 10232 | 129397 | 01:00:22.00 | 12:08:05.94 | 02:51:58.54 | 12777708 | 1490% | 18599544 |
| TokuDB | 07:44.10 | 09:17.31 | 02:54.82 | 1.5775263952 | 12665136 | 4601 | 70208 | 01:00:15.00 | 03:02:37.44 | 11:21:45.00 | 15328956 | 1434% | 23315964 |
| WiredLSM | 07:10.50 | 19:25.80 | 02:31.10 | 3.0590011614 | 12254620 | 10194 | 278415 | 01:00:05.00 | 15:51:04.17 | 00:02:09.76 | 16016296 | 1586% | 17723992 |
| WiredBtree | 02:07.49 | 01:49.52 | 00:17.97 | 1 | 11932620 | 10145 | 1320939 | 00:20:58.10 | 05:06:13.60 | 00:05:14.87 | 23865368 | 1560% | 20743232 |
This graph shows the load performance as throughput over time:
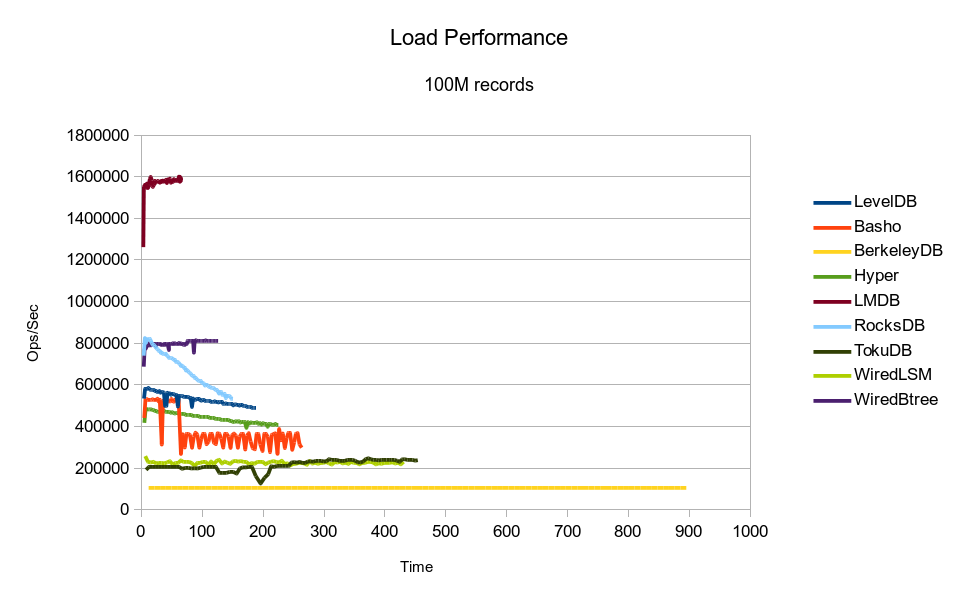
It's a bit more revealing than the 20M test. BerkeleyDB continues to deliver
its rock-steady throughput. LevelDB and Basho shows the infamous negative spikes
in throughput caused by periodic compaction, although Basho's later performance
seems even more pathological than usual. RocksDB shows linearly decaying
throughput with data volume. LevelDB and HyperLevelDB show asymptotically
decaying throughput.
(Note: in the raw output you'll see that we also ran LMDB and WiredTiger Btree for an hour, like all the others. Just to show that nothing self-destructs over time. LMDB can handle whatever workload you throw at it, non-stop.)
The significance of a Single-Level-Store design cannot be overstated - when working with an in-memory workload, every redundant byte means one less byte for useful data. One may easily find that workloads that are too large to operate in-memory with other DB engines fit smoothly into RAM using LMDB. And moreover, LMDB delivers in-memory performance without requiring the use of volatile storage (like tmpfs), so there's no need to worry about migrating to a different storage engine as the data sizes grow.
The space used is a major concern even in this testing environment. The RocksDB test used a server with 144GB of RAM for 500 million records, which should have consumed about 60GB. With runtime overheads, they ended up at around 75GB total. On our server with 128GB of RAM, the tmpfs will only hold 64GB. It's just barely large enough for LMDB to duplicate the 500M record test, but none of the other DB engines will fit. This is unfortunate, because we can't get a directly comparable (500 million record) result on the current setup. But our 64 core server with 512GB of RAM should be getting freed of VM hosting duty soon, so we'll be running some additional tests on that box in the near future.
In the original RocksDB test, they ran RocksDB with a WriteAhead Log enabled, to persist the data onto a disk while operating on tmpfs. We were unable to run the test this way because of a bug in the current RocksDB code. With LMDB such measures are unnecessary anyway, since LMDB can operate on top of a regular filesystem instead of requiring tmpfs.
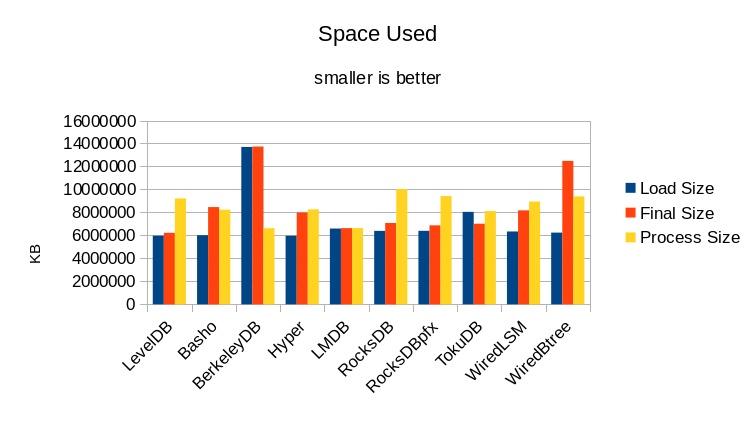
4. Small Set on Disk
Since using the tmpfs basically ate 50% of the RAM in the system, that puts a severe
constraint on how large a data set can be managed. Also, this is an unrealistic way
to use a database since none of the data will actually be persisted to real storage.
Given how much time it takes some of these engines to load the databases, one would
not want to have to reload the full contents before every run.
As such, we also decided to test on a regular filesystem. We are still using a data
set smaller than the size of RAM,
but since we're not sacrificing 50% of RAM for tmpfs, the data set can be larger
than in the prior test. On the laptop we use 50M records, so around 6GB of data.
It's using a 512GB Samsung 830 SSD and an ext4 partition.
The actual drive characteristics should not matter because the test datasets still fit entirely in RAM and are all using asynchronous writes. I.e., there should still not be any I/O occurring, and no need for the test programs to wait for any writes to complete. Here are the tabular results:
| Engine | Load Time | Overhead | Load Size | Writes/Sec | Reads/Sec | Run Time | Final Size | CPU% | Process Size | ||||
|---|---|---|---|---|---|---|---|---|---|---|---|---|---|
| Wall | User | Sys | KB | Wall | User | Sys | KB | KB | |||||
| LevelDB | 00:01:57.22 | 00:02:17.64 | 00:00:35.51 | 1.4771370073 | 5974496 | 10228 | 151800 | 00:23:11.69 | 01:20:31.83 | 00:07:01.87 | 6226672 | 377% | 9213436 |
| Basho | 00:02:38.02 | 00:04:15.20 | 00:01:25.90 | 2.1585875206 | 6017488 | 10229 | 8773 | 02:02:03.00 | 05:12:44.05 | 02:12:08.07 | 8465664 | 364% | 8234040 |
| BerkeleyDB | 00:08:46.95 | 00:05:26.20 | 00:01:10.82 | 0.7534301167 | 13700356 | 7479 | 70443 | 00:49:44.61 | 01:57:17.31 | 00:51:02.52 | 13732924 | 338% | 6626740 |
| Hyper | 00:02:07.81 | 00:02:32.24 | 00:00:28.51 | 1.4142085909 | 5966828 | 10225 | 194245 | 00:18:04.71 | 01:08:37.70 | 00:02:12.70 | 7997988 | 391% | 8269804 |
| LMDB | 00:00:31.79 | 00:00:22.14 | 00:00:09.59 | 0.998112614 | 6595848 | 10234 | 1374886 | 00:02:33.24 | 00:09:59.38 | 00:00:07.25 | 6627556 | 395% | 6630132 |
| RocksDB | 00:00:38.44 | 00:00:41.59 | 00:00:24.19 | 1.7112382934 | 6395296 | 10230 | 127147 | 00:27:30.99 | 01:45:55.57 | 00:03:01.70 | 7076928 | 395% | 10040740 |
| RocksDBpfx | 00:05:24.55 | 00:05:50.76 | 00:00:24.54 | 1.1563703594 | 6398448 | 10233 | 424119 | 00:08:17.61 | 00:26:57.26 | 00:05:14.13 | 6875504 | 388% | 9426456 |
| TokuDB | 00:04:35.62 | 00:04:19.69 | 00:01:59.10 | 1.3743197156 | 8051428 | 174 | 43529 | 01:20:20.00 | 04:17:36.94 | 00:46:30.35 | 7016752 | 378% | 8120724 |
| WiredLSM | 00:03:11.62 | 00:07:15.99 | 00:01:28.38 | 2.7365097589 | 6337132 | 10219 | 135590 | 00:25:48.88 | 01:39:58.05 | 00:00:58.35 | 8184716 | 391% | 8948796 |
| WiredBtree | 00:01:15.99 | 00:00:42.43 | 00:00:12.27 | 0.7198315568 | 6243828 | 9948 | 238957 | 00:15:05.25 | 00:39:29.28 | 00:08:36.82 | 12487884 | 318% | 9396320 |
There are other significant differences to point out in this test run. In the prior tests, each engine was basically run with default settings; the only non-default was the cache size. For this test we adopted the tuning options that RocksDB used in their report for the LevelDB-related engines. We also set LMDB to use its writable mmap option instead of the default read-only mmap.
For TokuDB, the test always crashed from running out of memory when configured with a 6GB cache (even though there was still a couple GB of RAM free on the machine) and so we had to pare it back to 4GB to get a complete run.
The Basho test was manually terminated at the 2 hour mark. It would have taken at least 6 or 7 more hours to complete on its own.
Update - 2014-06-16: Due to a transcription error when copying the RocksDB parameters from their site, we were still using the default memtable representation in the previous runs. We have re-run this particular test using "--key_size=16 --prefix_size=16 --keys_per_prefix=0 --memtablerep=prefix_hash" and added the result as "RocksDBpfx" to the table above and in the new charts below. Sorry for the mistake.
This graph shows the load performance as throughput over time:
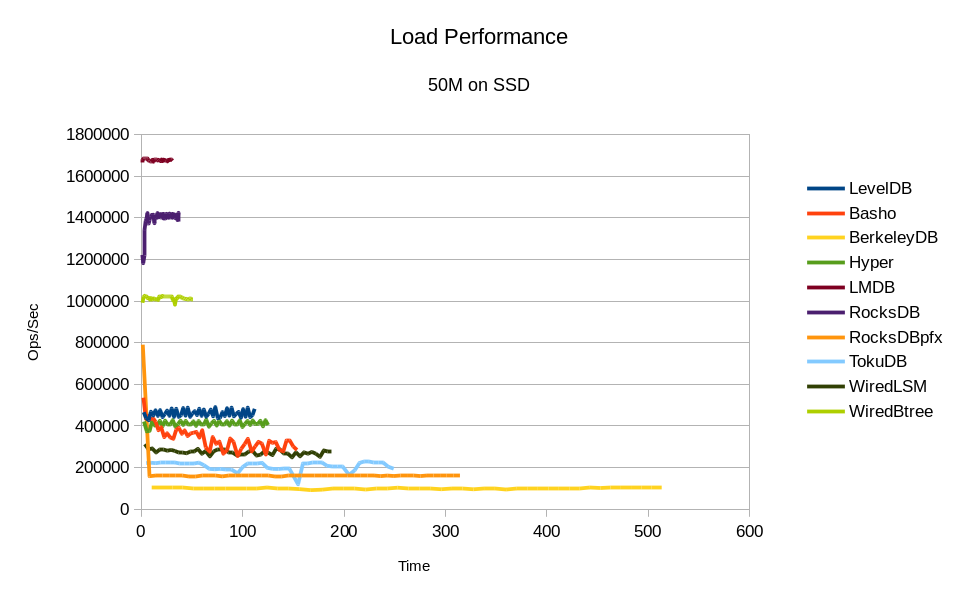
With the large Write Buffer Size set, all of the LevelDB-based engines turn in
closer-to-linear throughput, but Basho still shows a steady decline, and all of
them are still quite erratic.
This test highlights another major problem with so many of these engines - they all require complex tuning to get decent performance out of them. The tuning complexity of BerkeleyDB was one of the main issues that prompted us to write LMDB in the first place. Tuning RocksDB for this test requires explicit setting of 40-some parameters, as seen in the command scripts. This is an unreasonable demand on end-users, and indeed there's an open bug report for RocksDB on this very issue.
One of the many lessons we learned from 15+ years of working with BerkeleyDB is that adding code to address performance issues only makes things slower overall, harder to use, and harder to maintain. The key to good performance is writing less code, not more. Quality is always more important and more effective than quantity. This is why we put the Footprint overview right up front, in Section 1 - if you scan back through this report you can easily see how code size correlates to performance.

TokuDB's performance seems to really suffer from the 2GB reduction in its cache size. Unfortunately, there was no way to give it any more memory.
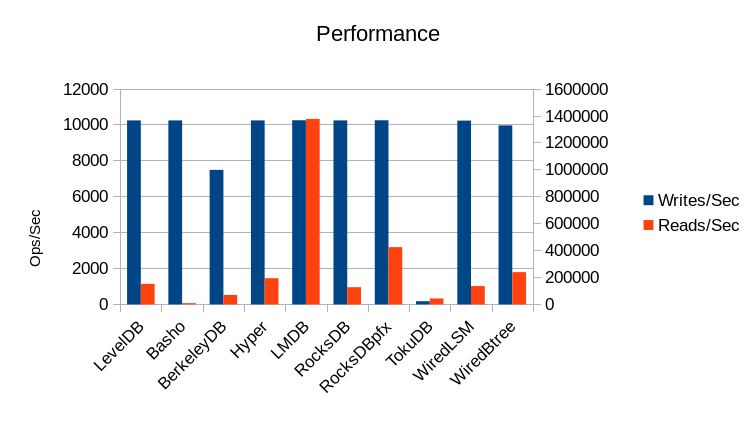
None of the other engines are anywhere close to LMDB's read rate. This result demonstrates that, as we've said before, LMDB delivers the read performance of a pure-memory database, while still operating as a persistent data store.
See the Details page for a detailed analysis of each engine's performance in this test.
All of the DB engines besides LMDB bumped into the limits of the memory on the machine. In contrast, LMDB would easily handle twice as much data and still leave a few GB of RAM to spare, and continue to perform at top speed.
In a private conversation, a Tokutek engineer admonished me "you have to give TokuDB at least 50% of RAM, otherwise it's not fair to compare it to an mmap'd database that can use as much RAM as it wants."
Here's the reality - LMDB uses less RAM than every other DB engine to get its work done. If your engine needs 4x as much RAM to do its work, then your engine is inherently limited to doing 4x less useful work on any given machine. Why should anyone waste their time and money on a system like that?
With LMDB you get your work done with no added overhead. LMDB stores just the data you asked it to store, with no logging or other cruft, so you get the most use out of your available RAM and disk space. LMDB uses the minimum amount of CPU to store and retrieve your data, leaving the rest for your applications to actually get work done. (And leaving more power in your battery, on mobile devices.) No other DB engine comes anywhere close.
5. Further Testing
Check out our even larger test which really drives the
point home - results for one billion records.
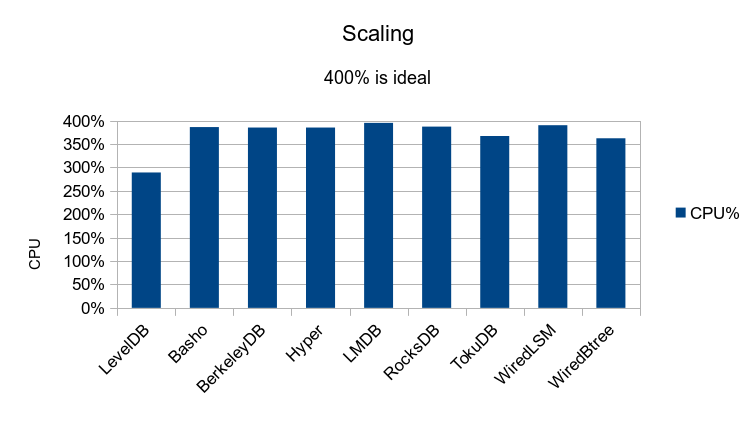
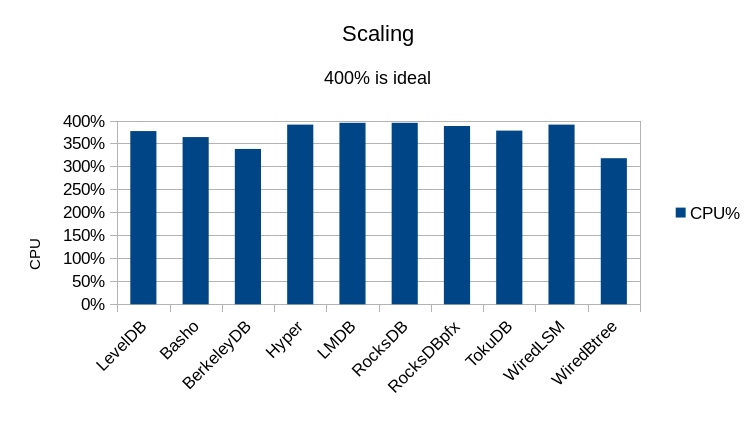
A new test has also been added to show scaling with the number of reader
threads.
The software versions we used:
Software revisions used:

violino:/home/software/leveldb> g++ --version
g++ (Ubuntu/Linaro 4.7.3-1ubuntu1) 4.7.3
Copyright (C) 2012 Free Software Foundation, Inc.
This is free software; see the source for copying conditions.  There is NO
warranty; not even for MERCHANTABILITY or FITNESS FOR A PARTICULAR PURPOSE.

violino:/home/software/leveldb> git log -1 --pretty=format:"%H %ci" master
e353fbc7ea81f12a5694991b708f8f45343594b1 2014-05-01 13:44:03 -0700

violino:/home/software/basho_leveldb> git log -1 --pretty=format:"%H %ci" develop
16b22c8198975b62a938dff9910f4432772d253a 2014-06-06 12:25:40 -0400

violino:/home/software/db-5.3.21> ls -l README
-rw-r--r-- 1 hyc hyc 234 May 11  2012 README

violino:/home/software/HyperLevelDB> git log -1 --pretty=format:"%H %ci" releases/1.0
a7a707e303ec1953d08cbc586312ac7b2988eebb 2014-02-10 09:43:03 -0500

violino:~/OD/mdb> git log -1 --pretty=format:"%H %ci"
a93810cc3d1a062bf5edbe9c14795d0360cda8a4 2014-05-30 23:39:44 -0700

violino:/home/software/rocksdb> git log -1 --pretty=format:"%H %ci"
0365eaf12e9e896ea5902fb3bf3db5e6da275d2e 2014-06-06 18:27:44 -0700

violino:/home/software/ft-index> git log -1 --pretty=format:"%H %ci" master
f51c7180db1eafdd9e6efb915c396d894c2d0ab1 2014-05-30 12:58:28 -0400

violino:/home/software/wiredtiger> git log -1 --pretty=format:"%H %ci"
91da74e5946c409b8e05c53927a7b447129a6933 2014-05-21 17:05:08 +1000
All of the engines were built with compression disabled; compression was not used in the RocksDB test either. Some of these engines recommend/require use of a non-standard malloc library like Google tcmalloc or jemalloc. To ensure as uniform a test as possible, all of the engines in this test were built to use the standard libc malloc.
Tests comparing tcmalloc and jemalloc are available in the malloc microbench report. Tests comparing different compression mechanisms are available in the compressor microbench report.