Symas Corp., June 2014
This data set is too large to run on our machine's 64GB tmpfs, so we store the database on an XFS partition of our server's storage array. This HP DL585 G5 has an HP Smart Array P400 controller with 8 HP DG146BABCF 146GB 10Krpm SAS drives attached, running in RAID5. The controller has 208MB of read cache and no write cache.
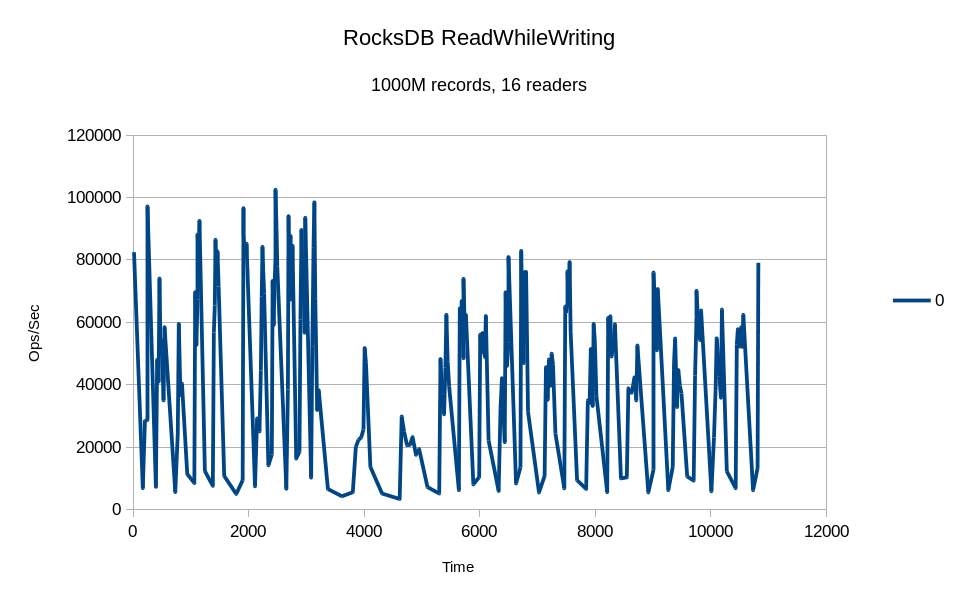
The RocksDB test focuses on multithreaded read performance for a purely in-memory database. The data set size for this test is still smaller than the machine's RAM, but as you'll see, most of the DB engines are too bloated to operate on it in a purely in-memory mode.
Test Overview
Using the server we generate a database with one billion records. The records have
16 byte keys and 100 byte values so the resulting database should be about 116GB
in size. After the data is loaded a "readwhilewriting" test is run using 16 reader
threads and one writer. All of the threads operate on randomly selected records
in the database. The writer performs updates to existing records; no records are
added or deleted so the DB size should not change much during the test.
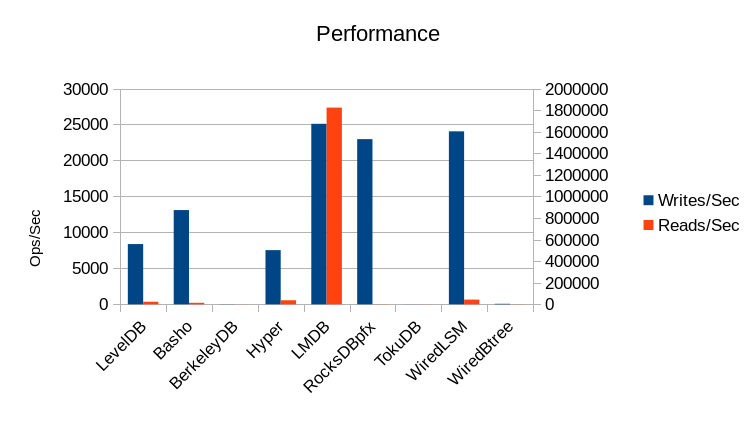
The pertinent results are tabulated here and expanded on in the following sections.
| Engine | Load Time | Overhead | Load Size | Writes/Sec | Reads/Sec | Run Time | Final Size | CPU% | Process Size | ||||
|---|---|---|---|---|---|---|---|---|---|---|---|---|---|
| Wall | User | Sys | KB | Wall | User | Sys | KB | KB | |||||
| LevelDB | 00:49:05.93 | 00:49:32.62 | 00:08:57.03 | 1.1913555312 | 113899644 | 8376 | 23809 | 03:00:37.00 | 05:38:40.47 | 00:50:20.16 | 123425380 | 215% | 122142816 |
| Basho | 02:59:15.00 | 02:29:49.02 | 00:35:05.30 | 1.0315499768 | 137026844 | 13101 | 14158 | 03:01:08.00 | 05:33:58.93 | 01:32:31.55 | 128267064 | 235% | 72605236 |
| BerkeleyDB | 13:13:26.00 | 04:12:01.15 | 00:33:27.76 | 0.3598056968 | 204824588 | 15 | 674 | 03:12:09.00 | 00:08:37.58 | 00:07:58.23 | 204799644 | 8% | 69855128 |
| Hyper | 01:13:44.00 | 01:00:02.31 | 00:09:58.77 | 0.9496112116 | 113944640 | 7526 | 37285 | 03:00:37.00 | 08:00:16.59 | 01:44:16.55 | 123031132 | 323% | 123462360 |
| LMDB | 00:11:49.87 | 00:08:44.59 | 00:03:05.15 | 0.9998168679 | 125806528 | 25092 | 1822989 | 02:26:30.00 | 18:00:18.92 | 00:15:44.15 | 125849876 | 1493% | 125852820 |
| RocksDBpfx | 02:39:36.00 | 02:57:52.19 | 00:06:27.98 | 1.1549885129 | 122080508 | 22966 | 1204 | 03:13:11.00 | 02:23:25.32 | 00:25:17.81 | 145562584 | 87% | 128229904 |
| TokuDB | 01:43:13.00 | 01:35:19.27 | 00:20:16.91 | 1.1200032295 | 122792020 | 3 | 667 | 03:00:31.00 | 00:20:59.31 | 00:09:12.73 | 122627344 | 16% | 75835612 |
| WiredLSM | 02:43:55.00 | 04:09:25.93 | 01:51:27.18 | 2.2016380275 | 120969092 | 24048 | 44189 | 03:20:30.00 | 07:33:12.19 | 02:18:10.51 | 152352148 | 294% | 120303088 |
| WiredBtree | 00:51:05.33 | 00:15:47.54 | 00:04:25.41 | 0.3956996473 | 119097476 | 74 | 1245 | 03:03:01.00 | 00:11:41.84 | 00:12:19.06 | 128724868 | 13% | 94761320 |
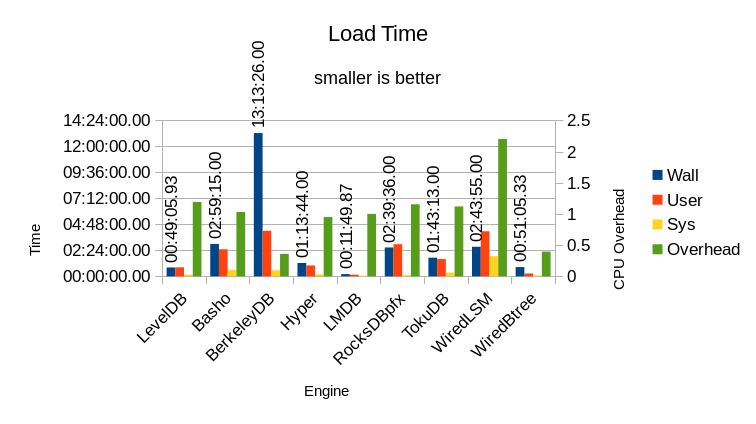
The "Overhead" column is the ratio of adding the User and System time together, then dividing by the Wall time. It is measured against the right-side Y-axis on this graph. This shows how much work of the DB load occurred in background threads. Ideally this value should be 1, all foreground and no background work. When a DB engine relies heavily on background processing to achieve its throughput, it will bog down more noticeably when the system gets busy. I.e., if the system is already busy doing work on behalf of users, there will not be any idle system resources available for background processing.
Only LMDB has an Overhead of 1.0 - it requires no background processing to perform the data load. The other two Btree engines, BerkeleyDB and WiredTiger, have ratios far below 1 - they're stuck waiting for I/O. The overhead of the other engines is also partially masked by their respective I/O wait times.
This graph shows the load performance as throughput over time:
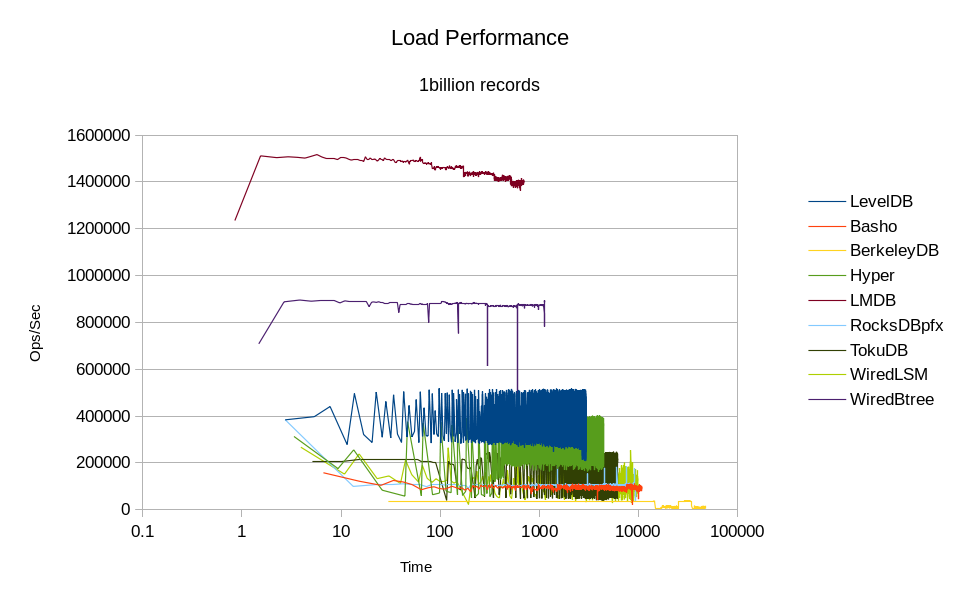
Due to the extremely long runtime of the BerkeleyDB load, a logarithmic scale was
used for the Time axis of this graph. This scale actually helps reveal some important
characteristics of these engines. Both LMDB and WiredTiger Btree show a stepwise decline
in throughput. Since they are Btrees, every time the number of records grows past a
certain threshold the tree height increases by one, which adds one more level of
indirection to every record lookup. The steps where these thresholds occur are easily
visible in the LMDB graph; they're visible to a lesser extent in the WiredTiger Btree
graph. Note also that the WiredTiger Btree actually finished loading its data in
about 19 minutes; the wall clock time stretched out to 51 minutes because the process
was waiting to flush all its data to disk before exiting.
The graphs for the other engines shows the main claim to fame for LSM designs - linear write speed on average. The actual throughput is still quite erratic and all of them are several times slower than LMDB.
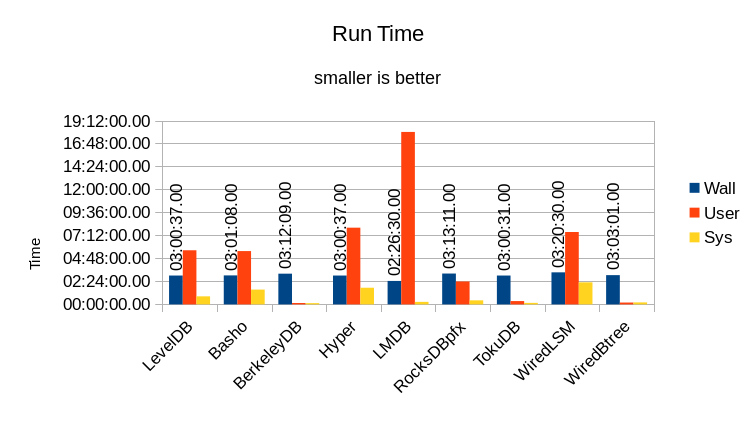
The total User and System time is expected to be much larger than the Wall time since a total of 17 threads are running (16 readers and 1 writer). Ideally the total should be exactly 16x larger than the Wall time.
How close each DB reaches the ideal is shown in this graph:
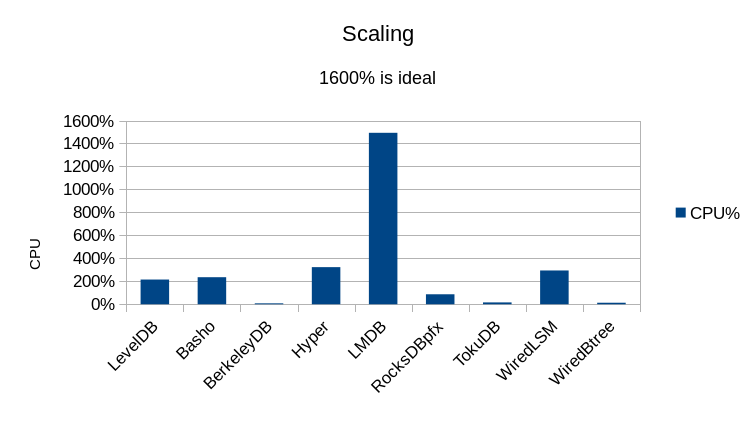
In fact LMDB runs at 1599% for the majority of the test, but the reader threads finish
at varying times, so eventually only a few reader threads remain, which lowers the
CPU utilization correspondingly. The rest of the engines are all heavily I/O bound.
The read speed for LMDB is under-reported here; the sustained read speed for the majority of the test run is over 2 million reads/second before the earlier-finishing threads drop out. (This still doesn't match the 7 million reads/second the RocksDB folks report, but then again the Xeon E5-2660 processors they're using are at least 3 years newer technology than our Opteron 8354s, and at least 5 times faster. In light of the results we've seen here, I'd expect LMDB on their hardware to easily hit tens of millions of reads per second.)
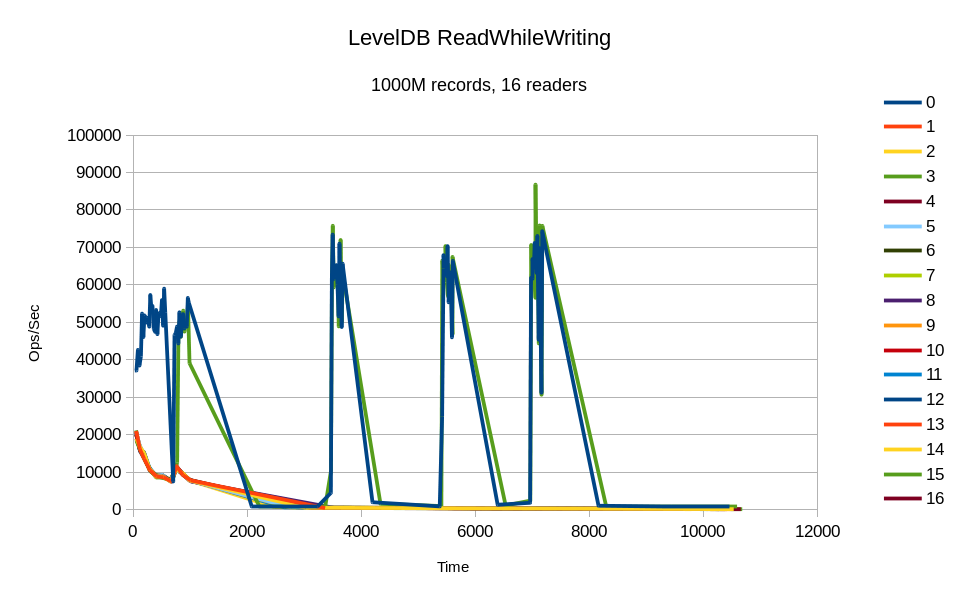
Detailed graphs of the per-thread throughput of some of the engines are included below. Not all of them are graphed, because some of them were so slow that they didn't produce any incremental stats output at all during their 3 hour run. (The incremental stats were printed after every 1048576 completed operations, so this means they were unable to complete that many operations in 3 hours.)
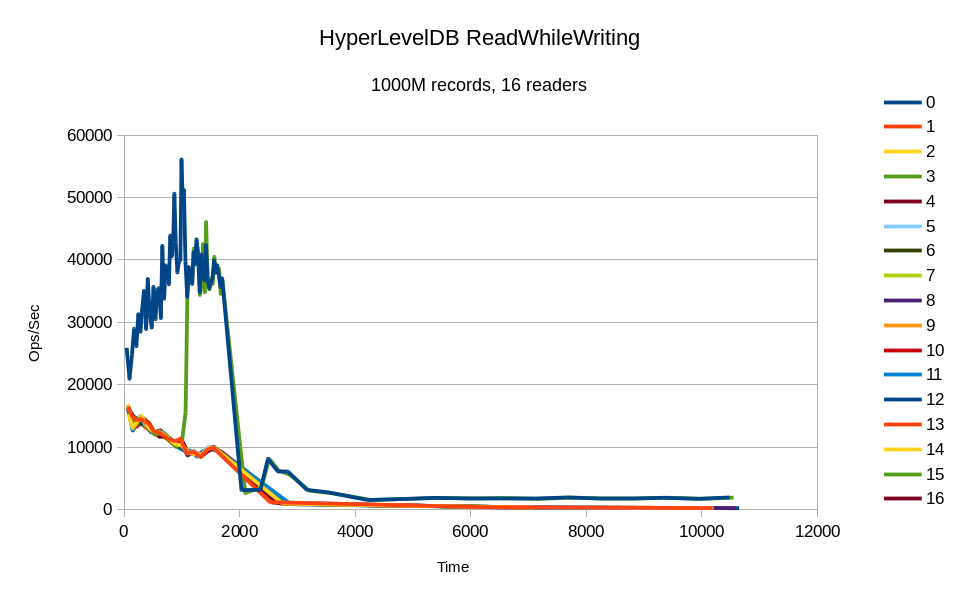
All of the reader threads were represented in the incremental stats output,
but only thread #3 made any progress. Its throughput basically mirrors the
writer's throughput, so apparently its I/O requests were piggybacking on the
writer's.
Only two of the reader threads produced any incremental stats. From the moment
they first register, they appear to piggyback on the writer's I/O requests.
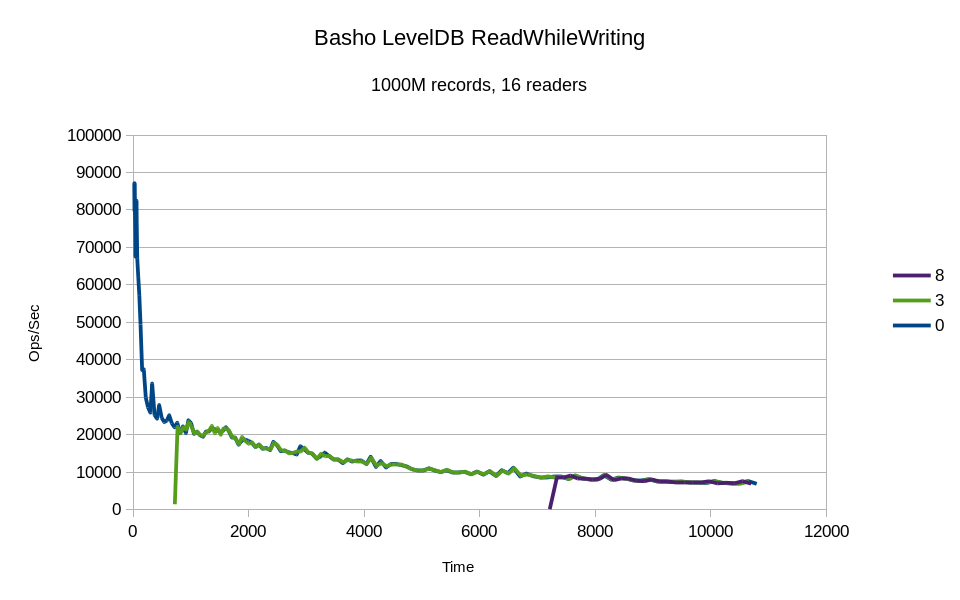
All of the reader threads were represented in the output, but only thread #3
made any substantial progress. After its initial spike it piggybacked with
the writer.
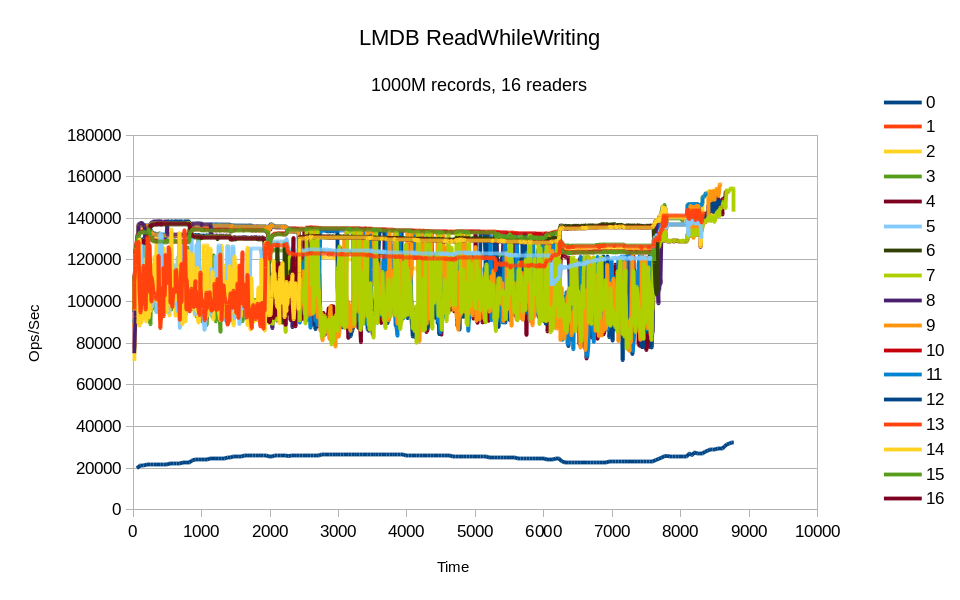
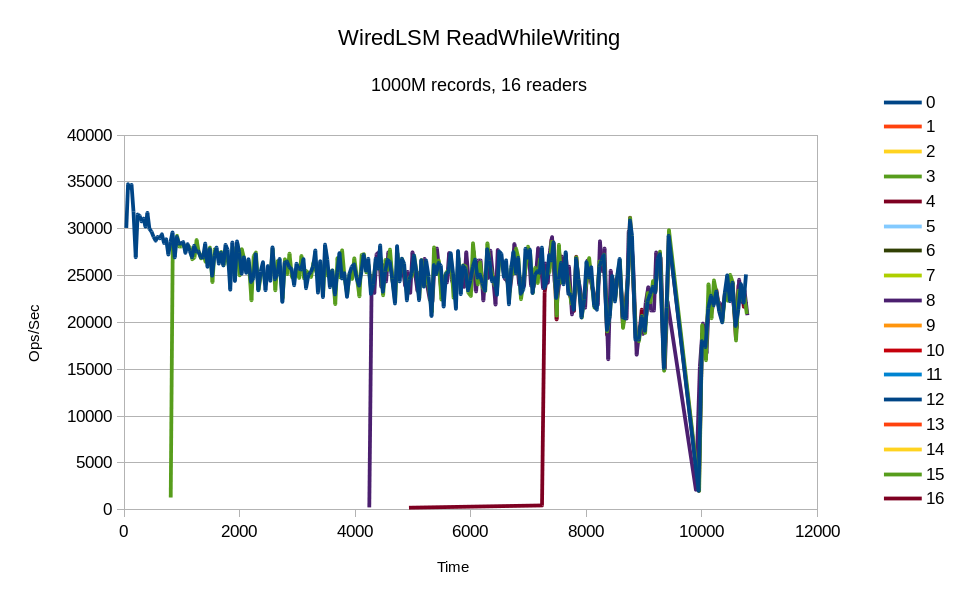
All of the threads were quite busy. While most of the readers' throughput is
quite erratic, there are several threads with basically constant throughput in the
graphs. Also at the tail end of the graph the effect of the various readers
finishing early is clearly seen, as the remaining threads jump up in
throughput. This is also obviously where the CPU utilization numbers drop
from 1599%.
Only the writer thread makes any progress here, the readers never showed up.
All of the threads reported at least one incremental result, but only 3
of the readers made any significant progress.
The recurring pattern of thread #3 and #8 making progress with the writer implies a systematic bias in the db_bench software. Perhaps the sequence of keys from the random number generator was falling into sync between these threads.
The LSM-based designs are clearly able to reach much higher peak write speeds than LMDB. However, none of these peaks can be sustained for more than a brief moment, and thus their overall throughput is still slower. LMDB delivers continuous consistent throughput for both reads and writes.
LMDB's lockless reader design already proves its effectiveness in the results shown above. Further evidence and explanation can be gleaned from another part of the raw test data - the number of context switches performed by each benchmark process. The results are shown as both Voluntary and Involuntary context switches. Voluntary context switches are those which occur when a program calls a function that can block - system calls, mutexes and other synchronization primitives, etc. Involuntary context switches occur e.g. when a CPU must handle an interrupt, or when the running thread's time slice has been fully consumed.
This table shows the number of context switches, taken from the 20M record test. (That test was chosen because it's the only one where every engine ran to completion, thus all of the runs executed the same number of DB read operations.)
| Engine | Loading | Running | ||
|---|---|---|---|---|
| Voluntary | Involuntary | Voluntary | Involuntary | |
| LevelDB | 10642 | 5585 | 116455055 | 1355109 |
| Basho | 9037 | 13967 | 1928 | 48625 |
| BerkeleyDB | 8 | 13623 | 34346315 | 635750 |
| Hyper | 14646 | 6132 | 1092068 | 324644 |
| LMDB | 8 | 1147 | 614 | 24227 |
| RocksDB | 3228 | 4509 | 4800997 | 407085 |
| TokuDB | 510534 | 17686 | 34719826 | 549808 |
| WiredLSM | 184208 | 30093 | 115320 | 245824 |
| WiredBtree | 190 | 1882 | 405932 | 47020 |
Here's the same data from the 1000M test.
| Engine | Loading | Running | ||
|---|---|---|---|---|
| Voluntary | Involuntary | Voluntary | Involuntary | |
| LevelDB | 3686077 | 6728 | 112807198 | 665694 |
| Basho | 17912728 | 33788 | 99867681 | 107827 |
| BerkeleyDB | 20269926 | 134482 | 6751787 | 15828 |
| Hyper | 3910975 | 12737 | 206860119 | 953399 |
| LMDB | 2846 | 4132 | 344 | 3734758 |
| RocksDB | 33637 | 12763 | 35652442 | 39954 |
| TokuDB | 10027037 | 21917 | 3154193 | 10858 |
| WiredLSM | 170367168 | 61996 | 44855944 | 19818800 |
| WiredBtree | 72089 | 2970 | 14358532 | 42041 |
These tables show one of the main reasons LMDB is so much faster than every other DB engine. All of the other engines have several orders of magnitude more context switches overall, and the vast majority of them are voluntary - that means blocking system calls and locking operations. In contrast LMDB has practically none; a detailed profile of these runs would show that the voluntary switches in these runs are mostly due to the db_bench framework, and not LMDB itself.
Instead, LMDB grabs hold of the CPU, uses it to the utmost, and doesn't let go until the OS forces it. This is one of the key bits of minutiae often overlooked in software designs, and where most systems fall down - they may have efficient-seeming algorithms on paper, but their implementations are riddled with inefficiencies. LMDB is lean and mean; there's no bloat and nothing getting in the way between your application and your data.
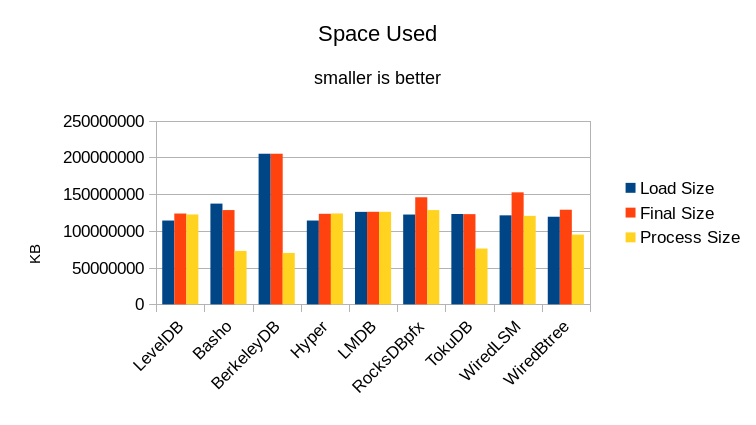
The Process Size shows the maximum size the test program grew to while running the test. In this case, many of the processes were bumping into the maximum memory limit of the machine. It's worth noting that Basho LevelDB, BerkeleyDB, TokuDB, and WiredTiger Btree were the only engines that actually seemed to honor their cache_size setting. As such they were configured with 64GB caches for this run. LevelDB, HyperLevelDB, RocksDB, and WiredTiger LSM appear to just expand to as much space is available; they were left with the 16GB cache setting used in previous runs. RocksDB caused the system to start swapping during its run and so the test had to be rerun with system swap disabled.
The definition of "what fits in memory" will also vary wildly depending on whose DB you're talking about. Everyone brags about their lightweight footprint but only one of these stories is true; only one DB engine actually lets you use the maximum proportion of your available system resources on your actual work. If you're looking to jump on the In-Memory bandwagon, there's only one viable choice.
With LMDB you get your work done with no added overhead. LMDB stores just the data you asked it to store, with no logging or other cruft, so you get the most use out of your available RAM and disk space. LMDB uses the minimum amount of CPU to store and retrieve your data, leaving the rest for your applications to actually get work done. (And leaving more power in your battery, on mobile devices.) No other DB engine comes anywhere close.
The software versions we used:
Software revisions used:

violino:/home/software/leveldb> g++ --version
g++ (Ubuntu/Linaro 4.7.3-1ubuntu1) 4.7.3
Copyright (C) 2012 Free Software Foundation, Inc.
This is free software; see the source for copying conditions.  There is NO
warranty; not even for MERCHANTABILITY or FITNESS FOR A PARTICULAR PURPOSE.

violino:/home/software/leveldb> git log -1 --pretty=format:"%H %ci" master
e353fbc7ea81f12a5694991b708f8f45343594b1 2014-05-01 13:44:03 -0700

violino:/home/software/basho_leveldb> git log -1 --pretty=format:"%H %ci" develop
16b22c8198975b62a938dff9910f4432772d253a 2014-06-06 12:25:40 -0400

violino:/home/software/db-5.3.21> ls -l README
-rw-r--r-- 1 hyc hyc 234 May 11  2012 README

violino:/home/software/HyperLevelDB> git log -1 --pretty=format:"%H %ci" releases/1.0
a7a707e303ec1953d08cbc586312ac7b2988eebb 2014-02-10 09:43:03 -0500

violino:~/OD/mdb> git log -1 --pretty=format:"%H %ci"
a93810cc3d1a062bf5edbe9c14795d0360cda8a4 2014-05-30 23:39:44 -0700

violino:/home/software/rocksdb> git log -1 --pretty=format:"%H %ci"
0365eaf12e9e896ea5902fb3bf3db5e6da275d2e 2014-06-06 18:27:44 -0700

violino:/home/software/ft-index> git log -1 --pretty=format:"%H %ci" master
f51c7180db1eafdd9e6efb915c396d894c2d0ab1 2014-05-30 12:58:28 -0400

violino:/home/software/wiredtiger> git log -1 --pretty=format:"%H %ci"
91da74e5946c409b8e05c53927a7b447129a6933 2014-05-21 17:05:08 +1000
All of the engines were built with compression disabled; compression was not used in the RocksDB test either. Some of these engines recommend/require use of a non-standard malloc library like Google tcmalloc or jemalloc. To ensure as uniform a test as possible, all of the engines in this test were built to use the standard libc malloc.