Symas Corp., June 2014
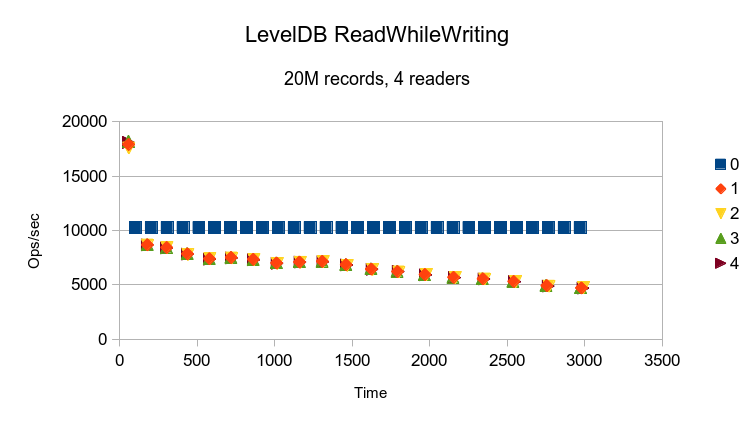
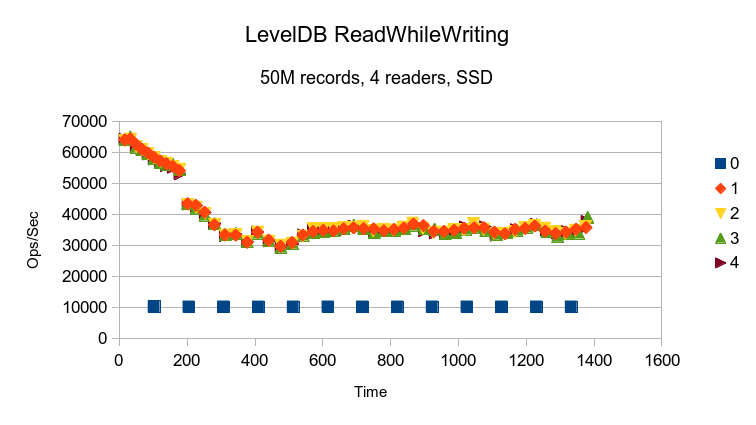
LevelDB is billed as a write-optimized design, and here we see that the writer
thread delivers constant 10K/sec performance while the reader threads run at continually
degrading performance.
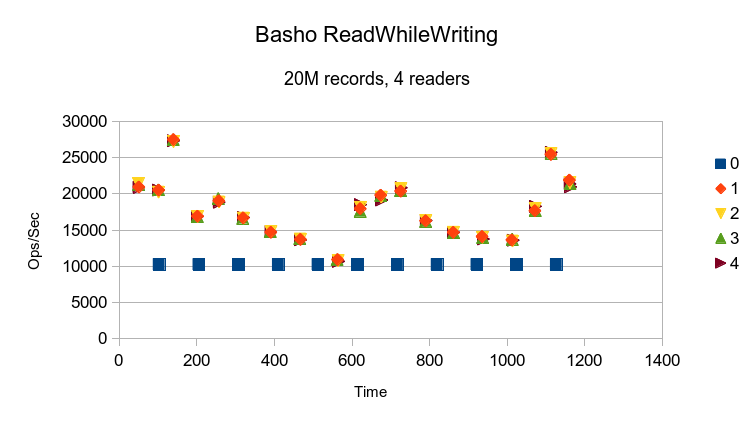
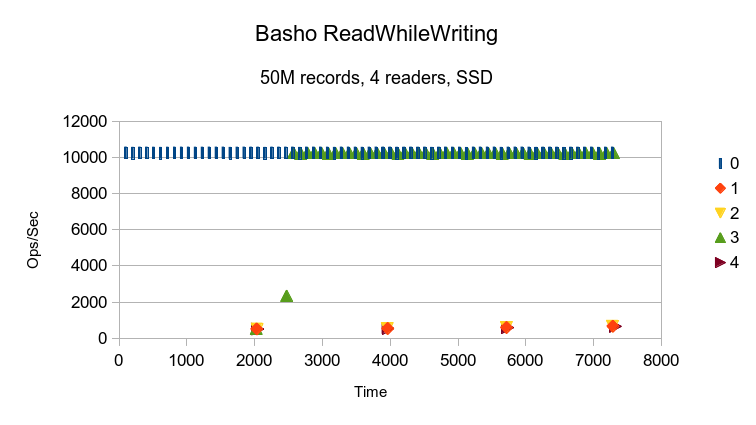
Basho's LevelDB also delivers consistent write performance, but read performance is all over
the map. Interestingly, all 4 reader threads have the same performance profile, which indicates
that the differences are not due to OS scheduler interference.
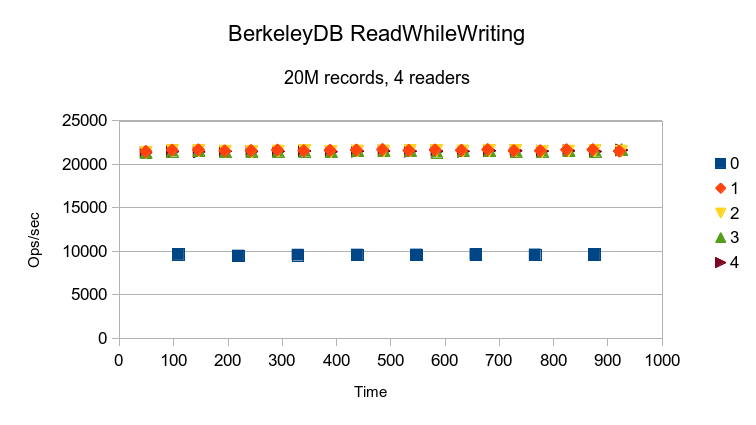
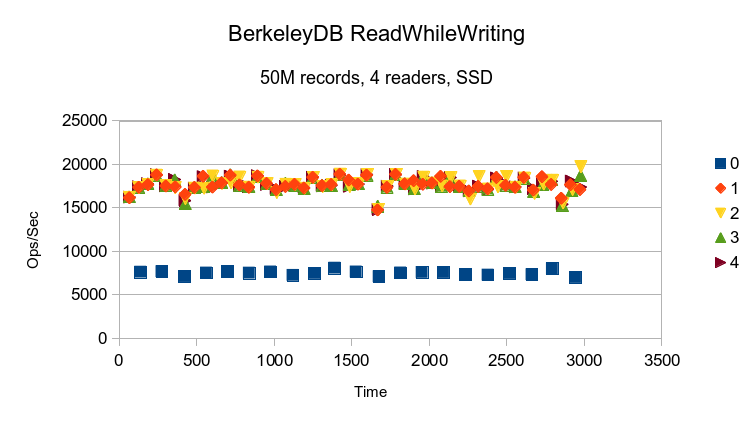
BerkeleyDB gives totally consistent throughput.
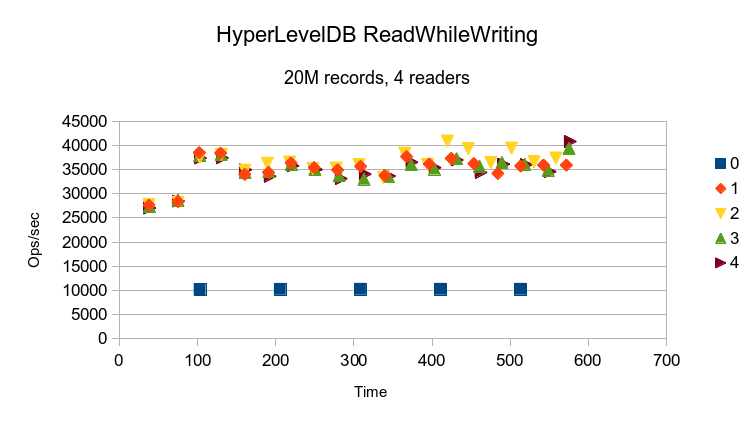
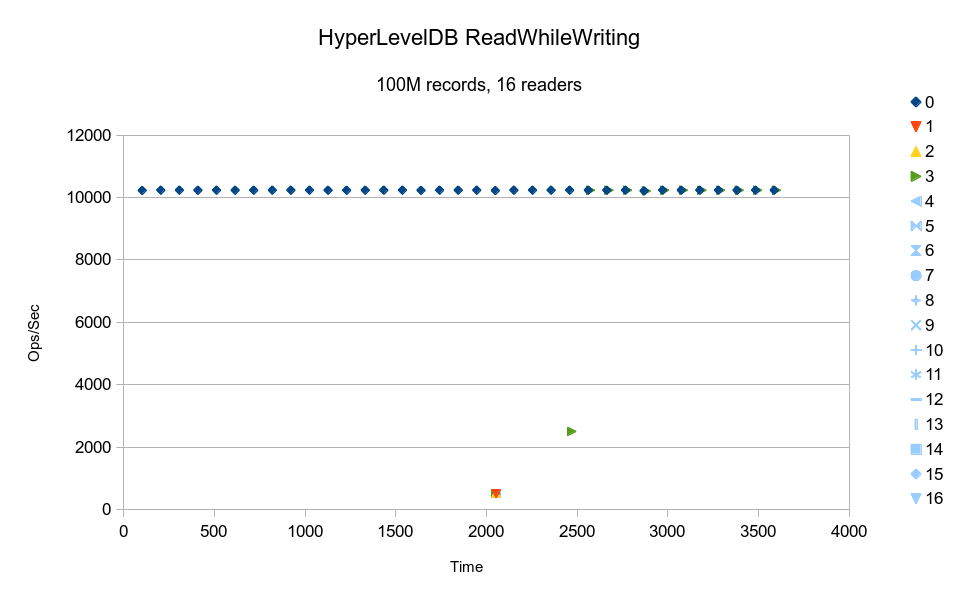
HyperLevelDB takes a couple minutes to ramp up its read performance. Not clear why, since
all data is resident in RAM already, i.e., one would not expect cache warmup time to be
a factor.
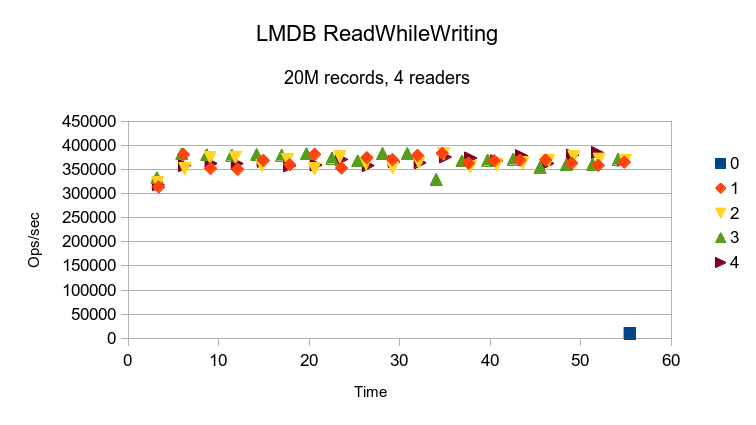
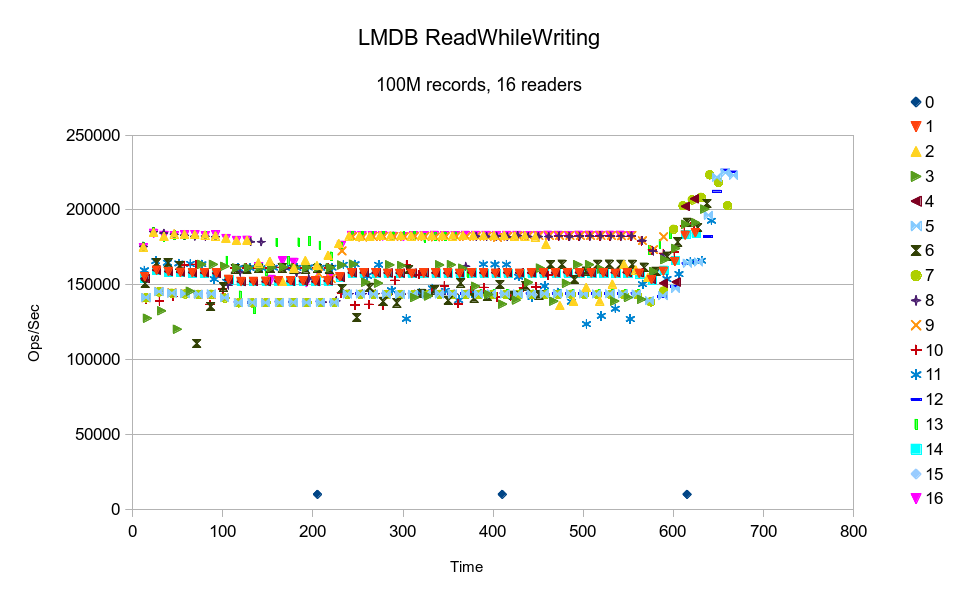
LMDB completes all of the reads before the writer thread ever gets to logging its first
data point. A single data point for the writer was manually inserted into this graph
just for reference. The variation in read performance between threads is solely due to
the OS scheduler. Since LMDB readers perform no mallocs or any blocking operations,
they only lose the CPU when a calling application performs some other blocking call.
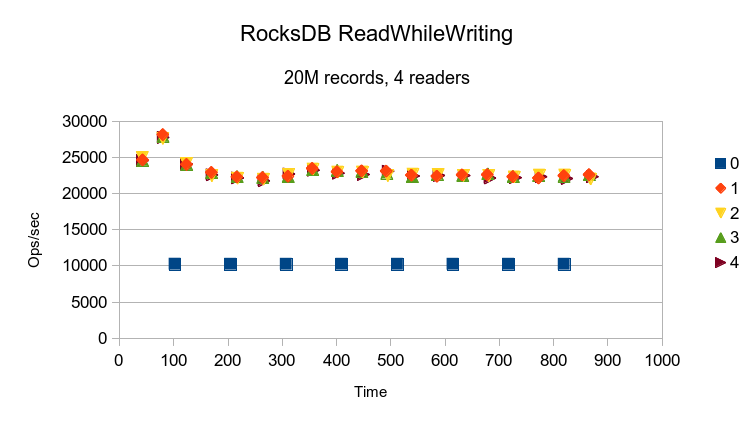
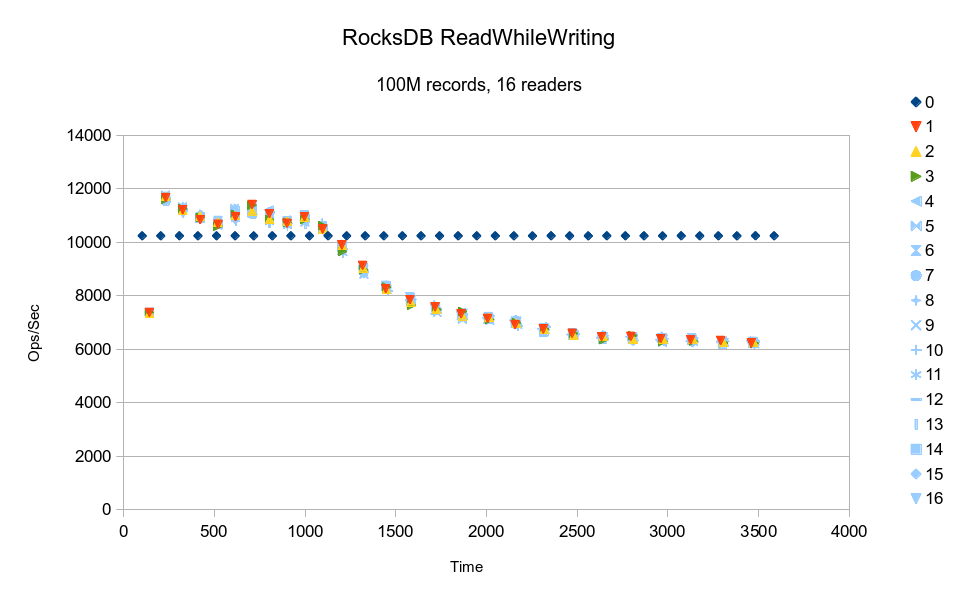
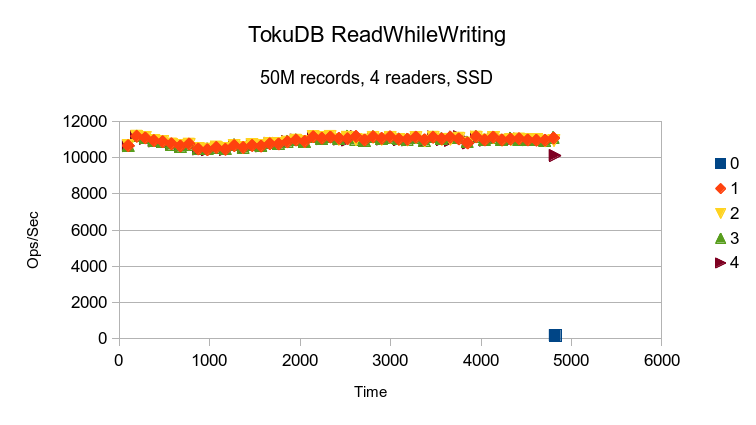
Aside from an initial peak, RocksDB delivers pretty consistent performance.
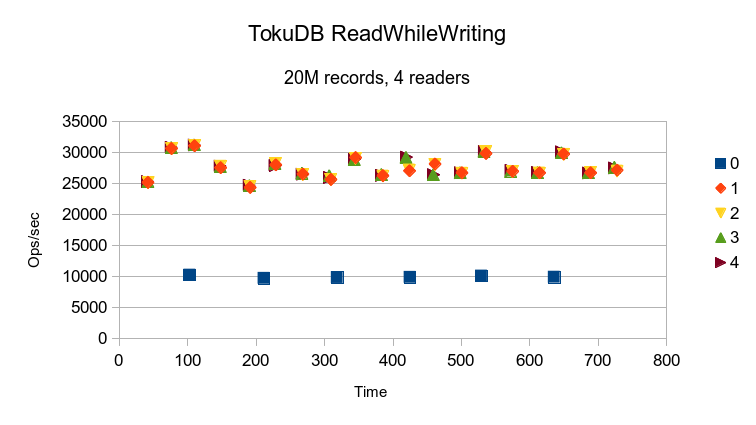
TokuDB's results indicate a cyclic variation, probably caused by periodic background
merges/compactions.
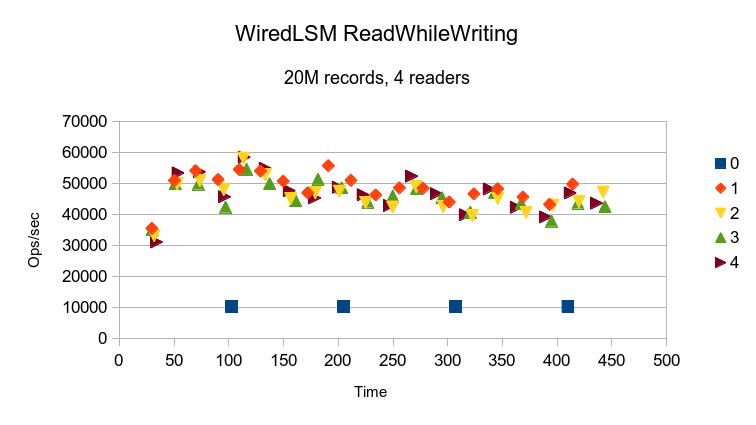
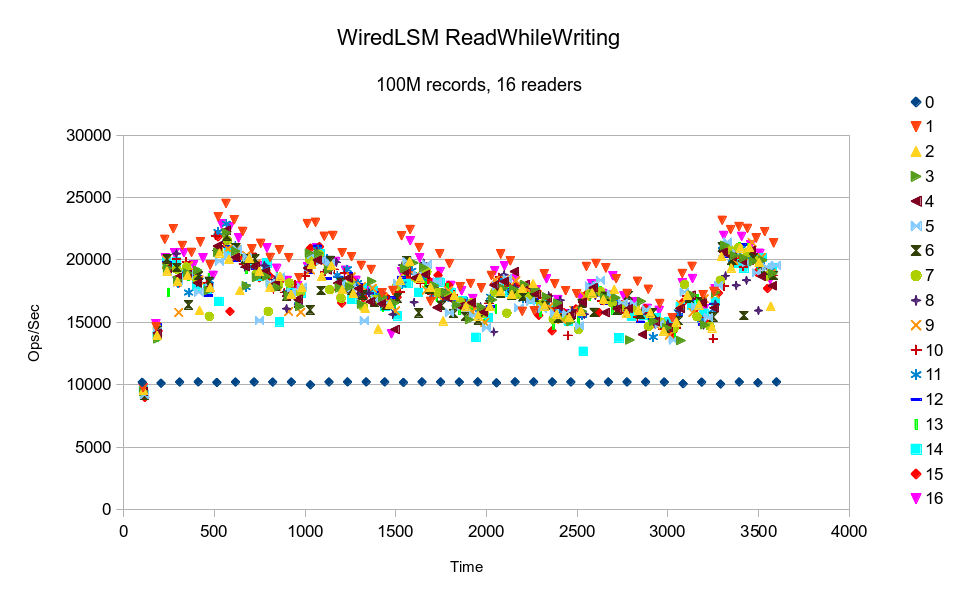
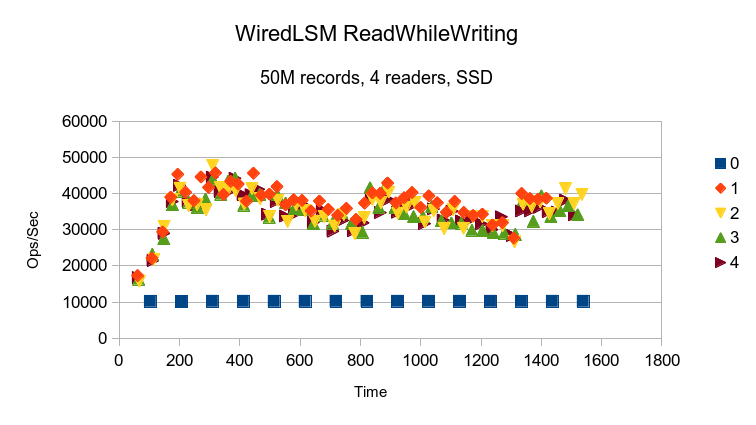
The WiredTiger LSM also shows cyclic variation in performance, again probably due to
periodic background compactions.
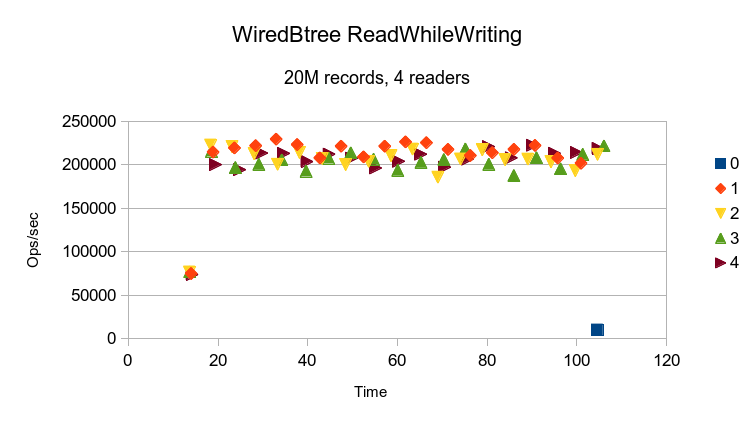
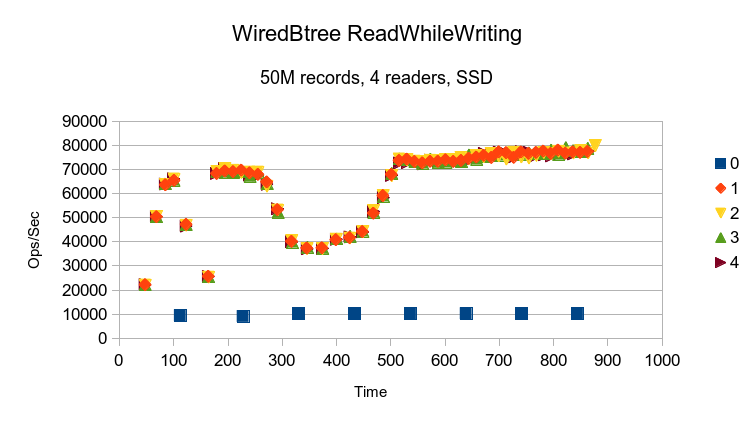
The WiredTiger Btree result is much like LMDB's, just at half the speed.
3. Larger Data Set
These graphs shows the throughput for each individual thread in the test. The read throughput
reported on the main page is the sum of all of the reader threads' throughput.
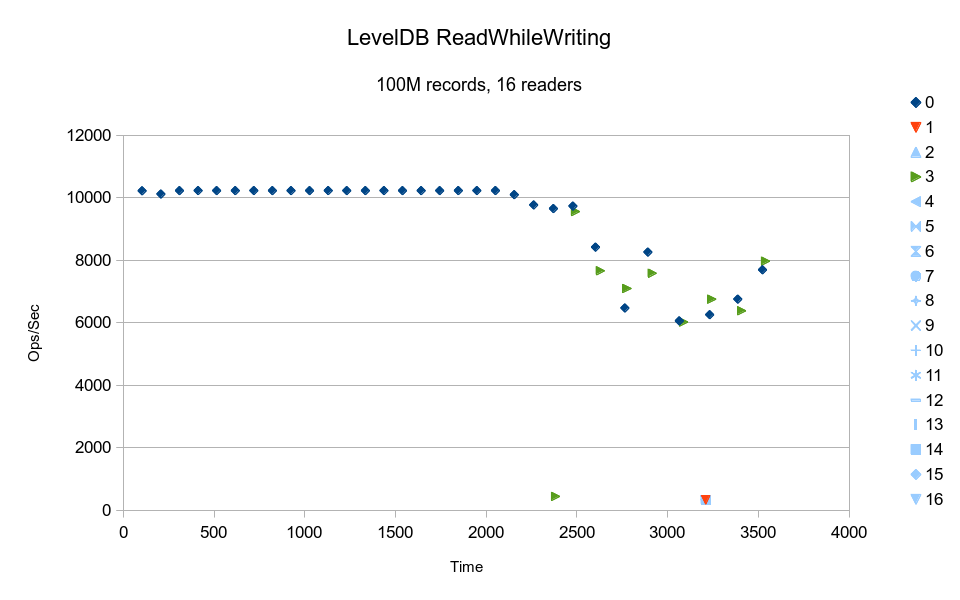
The LevelDB writer starts out with steady write throughput but collapses as it hits a
compaction point. All of the read threads start out at extremely low throughput, but
when compaction begins reader #3 suddenly jumps to keeping pace with the writer. All
of the other readers remain slow. All 15 of the other readers are running in lockstep,
indicating that they are all contending on a single lock and getting it in turn.
It's not clear why specifically reader #3 gets this
preferential treatment but the pattern is consistent through the remainder of the test.
The test was terminated at the 1 hour point. Assuming the readers continued at their
current speed, it would have taken over 84 hours to process all 100M records.
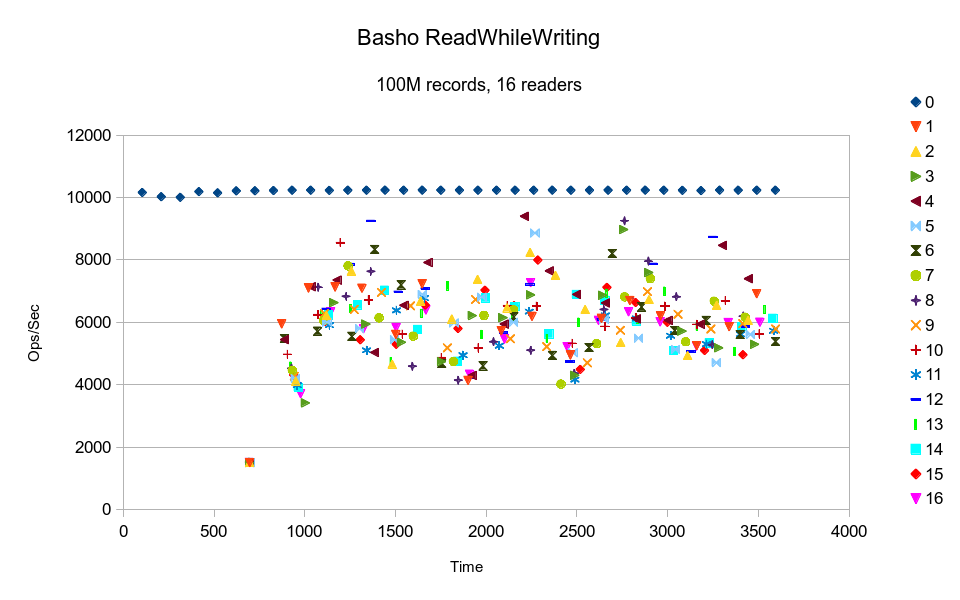
Basho's LevelDB also delivers consistent write performance, but read performance is all over
the map. At the given average, it would have taken close to 6 hours to complete the test.
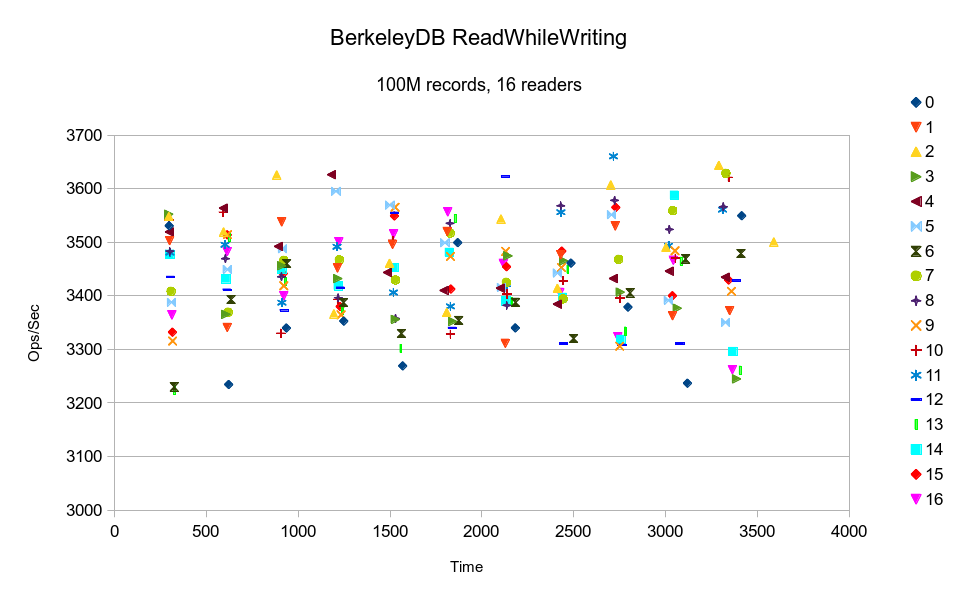
BerkeleyDB is also all over the map at this data volume. The vertical trends in the
graph indicate that all of the threads are contending on a single lock, and the
lockers appear to be acquiring the lock in random order. It would have taken over 8 hours
to finish the test.
HyperLevelDB's writer maintains a constant pace, while the readers are all barely
getting any work done. Again it seems that most of the readers are contending on a
single lock, but reader thread #3 somehow gets preferential treatment and makes a
little more progress than the others. Overall it would have taken over 38 hours to complete.
LMDB completed the test in just over 10 minutes. The strong horizontal trends in
the graph shows that generally the reader threads ran at constant speed. Since LMDB
readers make no blocking calls, generally nothing stops them from executing at full
speed (besides using up their time slice).
The graph
tapers upward towards the end because some threads finished before the others, and
so the remaining threads used the freed up CPU and accelerated. The fact that the
effect is so pronounced, when there should not have been very much CPU contention
to begin with, indicates a memory bandwidth limit being hit when all 16 readers
were active. (17 active threads on 16 cores, and the writer thread was throttled
so not even active 100% of the time; the readers shouldn't have had to fight for
CPU time.)
RocksDB shows an initial upward spike for the readers; the slow start generally indicates that
some type of cache was being filled. After that the readers follow a decaying
progression. Again, all of the readers are running in lockstep, which indicates
rigid synchronization/locking between reader threads. It would have taken around
3-1/2 hours to complete the test.

TokuDB's results indicate that it was cache-starved even on this pure-memory
configuration. The readers are also running in lockstep with each other; this
is another lock-based design. It would have taken over 6 hours to finish the test.
The WiredTiger LSM shows cyclic variation in performance, probably due to
periodic background compactions. It also has a slow initial ramp up, which
indicates some caches being filled. While the WiredTiger LSM is probably the
best LSM implementation we've seen, it still shows the inherent weaknesses
that all LSM designs suffer - periodic compaction means throughput will always
be widely varying. It also shows the weakness of systems that depend on
user-level caching - even when all of the data is already RAM-resident,
they can't deliver good performance until their internal caches are primed.
At least in this case, the readers' results are broadly distributed, which implies that they are not contending with each other over particular locks. It's definitely the highest throughput LSM design in this test, and would have probably completed in just under 2 hours.
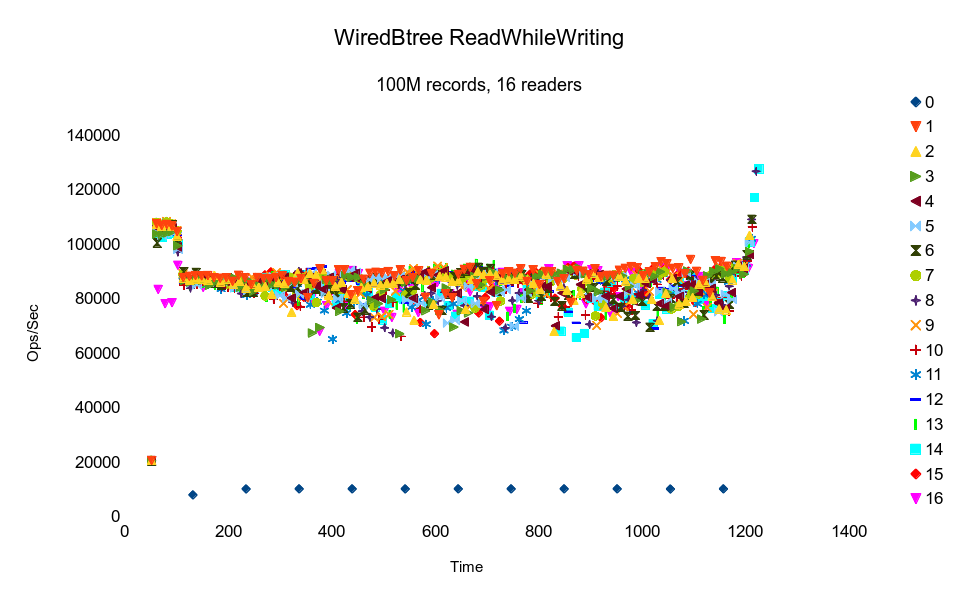
The WiredTiger Btree result again shows the characteristic initial ramp-up
from populating an internal cache. Unlike the LSMs, the ramp-up period
affects the writer thread too. The readers start out with a much higher
performance, then take a steep dive as the writer comes up to speed. This
implies that writers in this database block readers, i.e. it does not
appear to be an MVCC design. (The WiredTiger website claims that it supports
transactional semantics without blocking, not quite sure what to make of
this.) The readers results are evenly distributed across the Time axis,
indicating that they are not contending for locks between themselves. And
yet the tightly clustered results at the beginning quickly spread out to fairly
broadly divergent throughput rates, implying that some other contention is
breaking up the execution flow of each thread. So while a couple of threads
are delivering highly consistent throughput, the majority are experiencing
random amounts of delays. As with the LMDB graph, the results taper upward
at the end because some threads finish early, leaving more resources for
the remaining threads. The change is much steeper here, indicating a much
stronger contention effect.
4. Small Set on Disk
These graphs shows the throughput for each individual thread in the test. The read throughput
reported on the main page is the sum of all of the reader threads' throughput.
With the added Bloom Filter and Write Buffer size options, LevelDB finally starts
delivering read performance faster than its write performance. It still degrades
steadily from its initial peak, but then appears to maintain a reasonably stable
throughput. Probably this test scenario is too short to reveal any pathological
delays that future compactions could impose.
Running Basho LevelDB with the same Bloom Filter and Write Buffer Size options as
Google LevelDB yields strikingly different results. While in the 20M test it always
delivered faster reads than writes, here the readers are all slowed, except for
reader #3, which somehow manages to increase pace to match the writer's pace. Not
sure what to make of it. At the rate it was going, it would have taken around 7
hours to complete this test.
BerkeleyDB still gives fairly consistent throughput, but there are noticeable
downward spikes, probably from the periodic checkpoint which initiates cleanup
of old transaction log files.
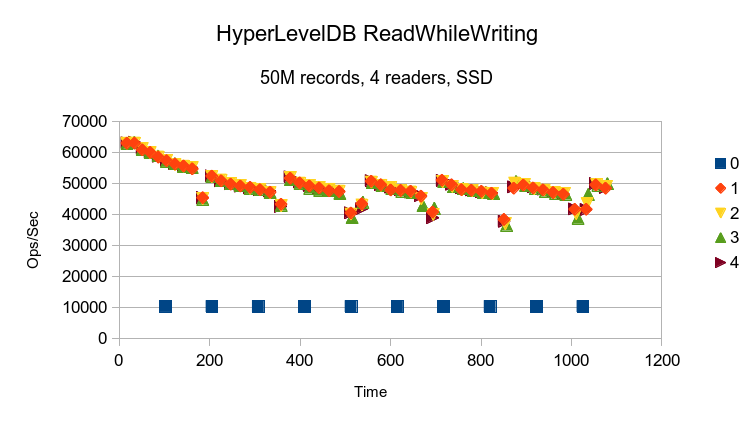
HyperLevelDB shows steadily decreasing read performance as writes progress. This
is followed by a sharp negative spike while compaction occurs, which then temporarily
increases read performance a modest amount.
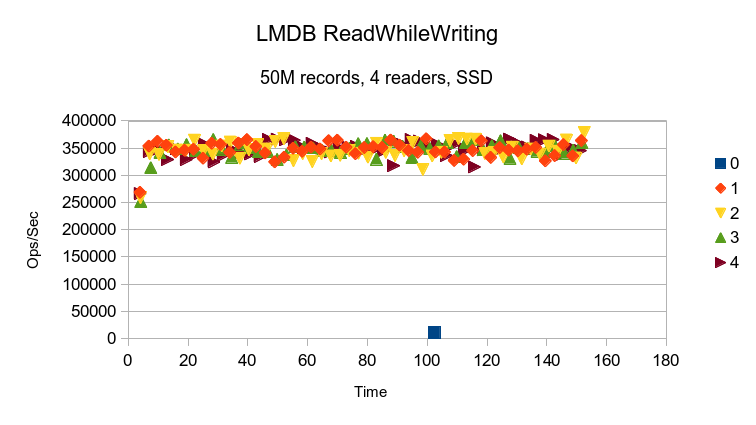
LMDB completes all of the reads while the writer only gets to log a single
data point. The graph has a very slight increasing slope, again due to one
reader thread finishing early and allowing another thread to use more resources.
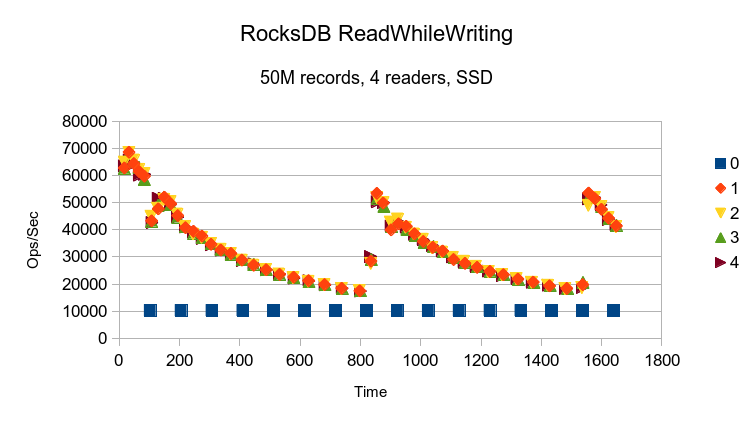
The RocksDB scenario looks much like the HyperLevelDB, although on a slower time scale.
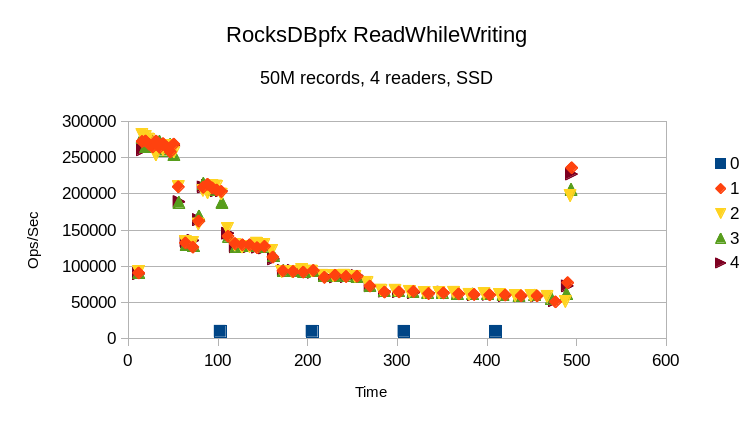
The RocksDBpfx scenario has the same basic shape as before, but starts faster before
decaying.
TokuDB's result here doesn't reveal much. The writer is apparently resource starved,
finishing only 174 writes in the 1 hour and 20 minutes of its run.
The WiredTiger LSM also shows cyclic variation in performance, again probably due to
periodic background compactions. It also shows the slow ramp up for its cache, and
otherwise shows the readers running at independent speeds, implying no locks between
readers.
The WiredTiger Btree result is rather inexplicable. There was no other system activity
during the test that could account for the shape of these results.