Symas Corp., September 2014
The cost of accessing a remote node can be from 60% greater to over 100% greater than accessing the local node, as shown by numactl -H:
node distances:
node   0   1   2   3   4   5   6   7
  0:  10  16  16  22  16  22  16  22
  1:  16  10  22  16  22  16  22  16
  2:  16  22  10  16  16  22  16  22
  3:  22  16  16  10  22  16  22  16
  4:  16  22  16  22  10  16  16  22
  5:  22  16  22  16  16  10  22  16
  6:  16  22  16  22  16  22  10  16
  7:  22  16  22  16  22  16  16  10
To discover how much this was affecting the benchmark performance, the entire series of tests was rerun using numactl --interleave=all which causes memory pages to be allocated across all of the nodes in round-robin fashion. Interleaving in this way should cause the single-thread case to run slower, since all of the accesses could feasibly be handled inside a single node. But for the 16 thru 64 thread cases it should speed up, since threads will be distributed across all of the nodes and at least 1/8th of their accesses will be local.
The results of running with NUMA interleaving are summarized below:
Loading the DB
Here are the stats collected from initially loading the DB.
| Local Alloc | Load Time | CPU % | DB Size | Process Size | Total Size | Context Switches | |||
|---|---|---|---|---|---|---|---|---|---|
| Wall | User | Sys | KB | KB | KB | Vol | Invol | ||
| LevelDB | 09:24.39 | 04:26.36 | 00:52.31 | 56 | 11702148 | 540488 | 12242636 | 204233 | 625 |
| Basho | 44:28.12 | 07:15.42 | 02:15.19 | 21 | 13128020 | 127916 | 13255936 | 85254 | 12304 |
| BDB | 52:32.77 | 11:51.71 | 02:59.45 | 28 | 38590332 | 21499600 | 60089932 | 1196561 | 3162 |
| Hyper | 09:12.10 | 05:15.21 | 01:11.65 | 70 | 11644136 | 725100 | 12369236 | 219303 | 2023 |
| LMDB | 01:05.73 | 00:45.22 | 00:20.43 | 99 | 12580708 | 12583076 | 12583076 | 9 | 192 |
| RocksDB | 10:53.73 | 02:39.76 | 00:46.74 | 31 | 11745460 | 624916 | 12370376 | 398909 | 325 |
| RocksDBpfx | 10:09.24 | 10:27.97 | 00:44.74 | 110 | 12207504 | 13456836 | 25664340 | 195089 | 1134 |
| TokuDB | 24:12.76 | 09:35.02 | 04:20.47 | 57 | 14991692 | 18798900 | 33790592 | 1091241 | 1951 |
| WiredLSM | 24:27.22 | 17:08.86 | 11:53.50 | 118 | 12607732 | 1156020 | 13763752 | 18163720 | 4903 |
| WiredBtree | 07:35.84 | 01:24.96 | 00:18.78 | 22 | 11909312 | 314008 | 12223320 | 7268 | 151 |
| Interleaved | Load Time | CPU % | DB Size | Process Size | Total Size | Context Switches | |||
| Wall | User | Sys | KB | KB | KB | Vol | Invol | ||
| LevelDB | 06:34.32 | 04:33.70 | 00:57.06 | 83 | 11702148 | 539660 | 12241808 | 195036 | 466 |
| Basho | 43:43.51 | 07:25.25 | 02:52.59 | 23 | 18093052 | 125328 | 18218380 | 73666 | 13061 |
| BDB | 50:19.81 | 13:09.63 | 02:45.54 | 31 | 39144188 | 21498344 | 60642532 | 1293051 | 3199 |
| Hyper | 10:28.11 | 05:15.28 | 01:21.64 | 63 | 11644136 | 719448 | 12363584 | 210183 | 1647 |
| LMDB | 01:09.76 | 00:45.37 | 00:24.29 | 99 | 12580708 | 12583116 | 12583116 | 10 | 243 |
| RocksDB | 10:54.27 | 02:39.77 | 00:51.77 | 32 | 11745460 | 624480 | 12369940 | 416688 | 366 |
| RocksDBpfx | 11:15.31 | 12:06.02 | 00:54.43 | 115 | 12207504 | 12344096 | 24551600 | 219820 | 2093 |
| TokuDB | 24:00.29 | 10:21.51 | 03:37.79 | 58 | 14351024 | 17673108 | 32024132 | 817791 | 2192 |
| WiredLSM | 25:05.43 | 17:52.91 | 10:43.36 | 114 | 13132576 | 1068356 | 14200932 | 19109520 | 3868 |
| WiredBtree | 06:19.92 | 01:27.93 | 00:20.30 | 28 | 11909312 | 314032 | 12223344 | 6335 | 199 |
Since the data set is the same as before the DB Size and Process Size were expected to be the same as before. The DB Size was identical to the previous run for LevelDB, HyperLevelDB, LMDB, RocksDB, and WiredTiger-Btree. But due to the vagaries of background processing, the DB Sizes were different for the other engines. The Process Sizes also changed slightly due to the change in memory allocation policy.
Since LMDB's load phase is purely single-threaded, it was expected to slow down slightly
when switching to Interleaved memory. The results show this to be the case, with the load
taking about 6% longer with Interleaving. For the other engines the difference is harder
to quantify. Engines with multi-threaded loaders tended to improve throughput, but the
differences are slight and runtime was mostly dominated by I/O waits. The following graph
shows the difference in times between the original and Interleaved run.
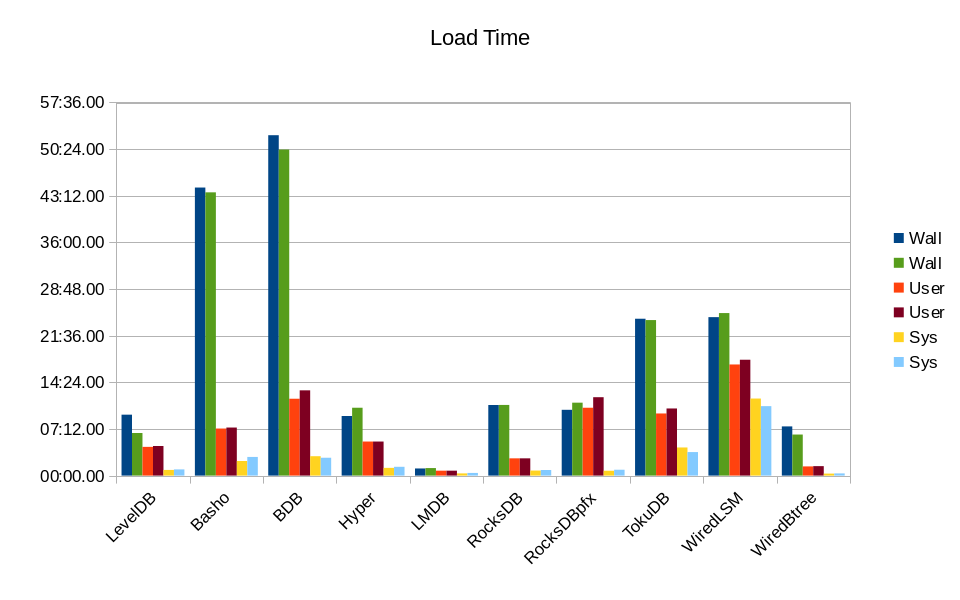
The Wall, User, and System CPU times are shown twice in the graph. For each pair of
measurements, the first column is from the original test and the second column is
from the Interleaved test.
Summary
The results for running the actual readwhilewriting test with varying numbers
of readers are shown here. These graphs only show the results with Memory Interleaving
enabled. (Refer back to the original Scaling test
for the corresponding graphs for comparison.)
Results are further broken down by DB engine in the following sections.
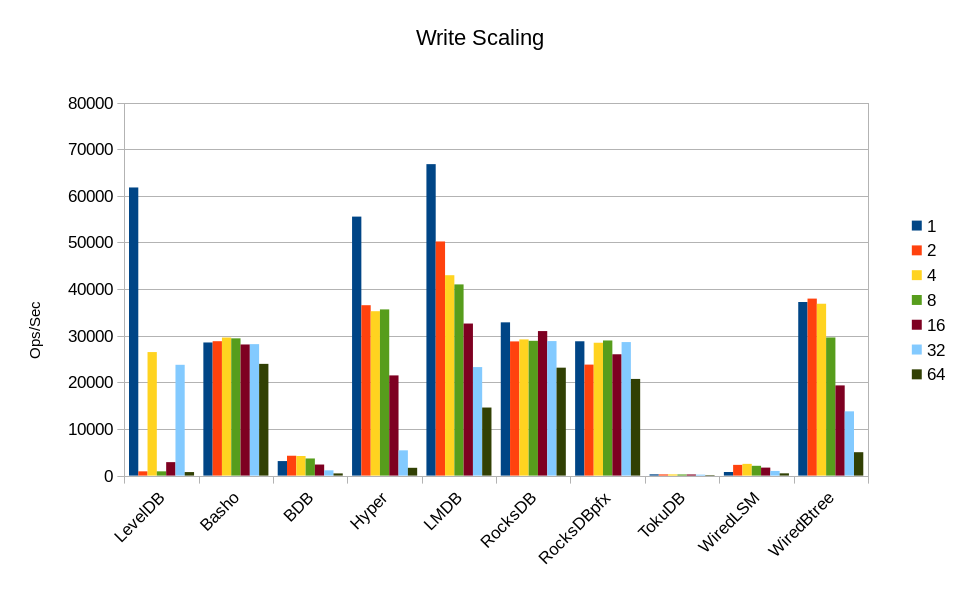
Several of the engines improved their Write throughput compared to the original test. Surprisingly, LMDB attains the fastest write speed from 1 to 16 threads. TokuDB remains the slowest at all load levels.
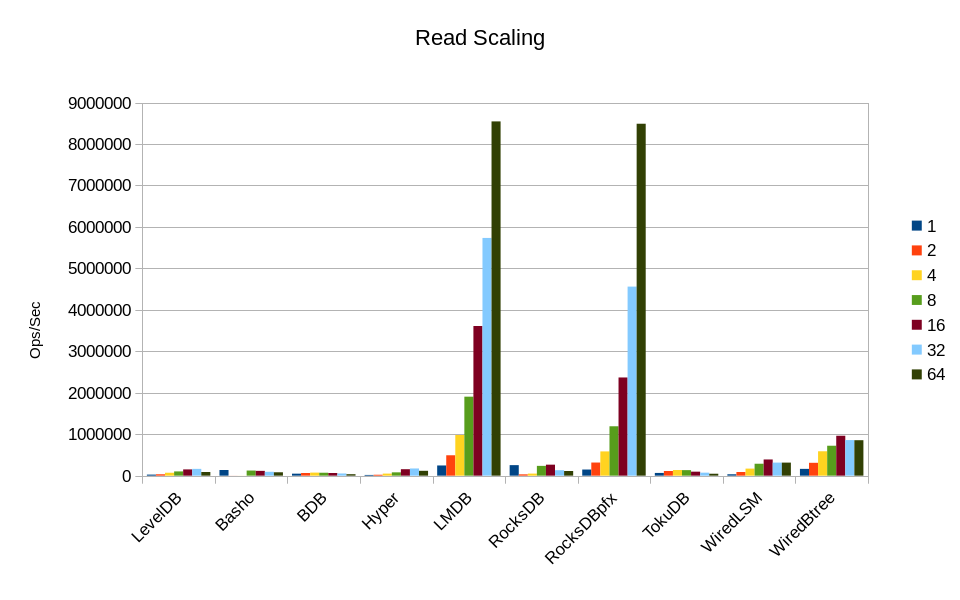
LMDB is still the leader here, with read performance scaling linearly with the number of cores. RocksDB in its highly tuned configuration is almost as fast. At 64 threads both appear to have hit the limits of the hardware; there aren't enough CPU cycles left to do any more work.
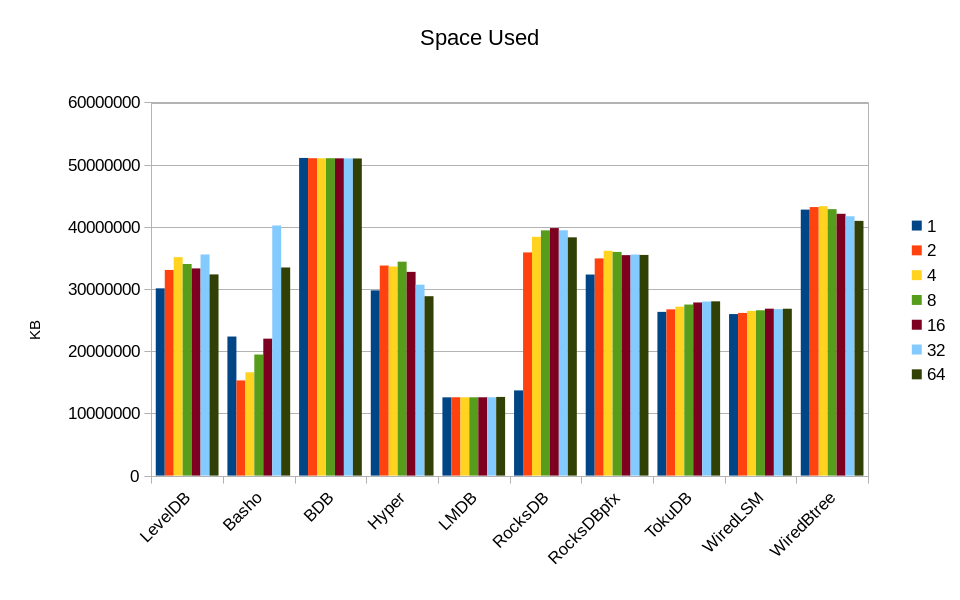
With the notable exception of BashoLevelDB, space usage appears to be about the
same as before.
The DB-specific results follow.
LevelDB
This table shows the results for the Memory Interleaved test. The graphs show both
the original results and the Interleaved results, for comparison.
| Threads | Run Time | CPU % | DB Size | Process Size | Total Size | Context Switches | Write Rate | Read Rate | |||
|---|---|---|---|---|---|---|---|---|---|---|---|
| Wall | User | Sys | Vol | Invol | |||||||
| 1 | 10:23.66 | 00:17:05.96 | 00:02:30.28 | 188 | 15456644 | 14659696 | 30116340 | 387878 | 2682 | 61786 | 24144 |
| 2 | 10:17.13 | 00:20:38.40 | 00:00:53.94 | 209 | 16933624 | 16132852 | 33066476 | 776714 | 3389 | 914 | 32459 |
| 4 | 10:23.60 | 00:41:12.84 | 00:02:56.12 | 424 | 16842780 | 18295256 | 35138036 | 2885905 | 2396 | 26483 | 70261 |
| 8 | 10:42.76 | 01:10:58.54 | 00:07:55.83 | 736 | 16627768 | 17397676 | 34025444 | 22808296 | 1681 | 911 | 102425 |
| 16 | 10:32.68 | 01:48:23.14 | 00:44:10.99 | 1446 | 16190744 | 17128824 | 33319568 | 86474410 | 3182 | 2878 | 149329 |
| 32 | 11:23.28 | 01:39:02.69 | 03:32:05.18 | 2732 | 16361540 | 19200948 | 35562488 | 45664320 | 153881 | 23754 | 162455 |
| 64 | 10:46.10 | 01:51:27.29 | 08:07:38.24 | 5563 | 15541352 | 16814236 | 32355588 | 17412585 | 58842 | 751 | 86666 |
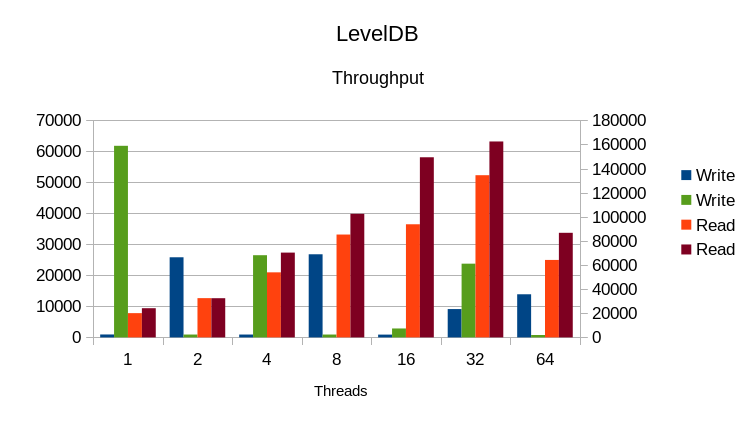
In this graph, the Write Rates are on the left Y-axis and the Read Rates use the right Y-axis.
In each pair of columns, the first column is the result from the original test and the second
is the result from the Interleaved test. The erraticness of the write speeds makes it difficult
to show the effect of Interleaving. The read speed shows a more obvious improvement for all
tests except the 2-reader test. It's still not enough of an efficiency improvement to overcome
the locking overhead and negative scaling above 32 threads though.
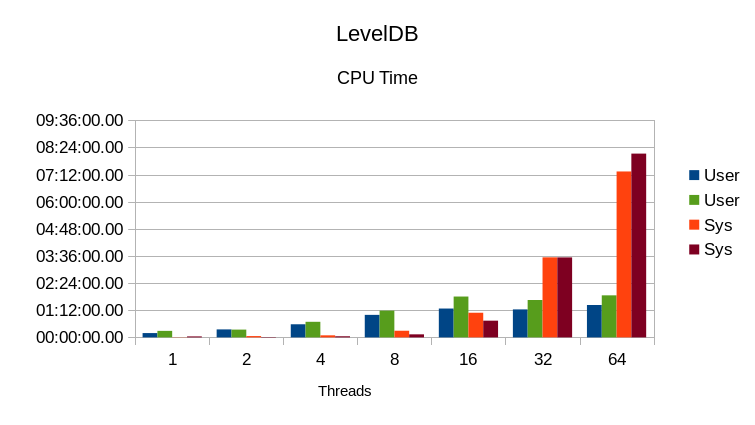
The User CPU time increases, which is the expected result since more useful work is getting done.
However, the System CPU time increases even more at 64 threads, which shows that NUMA memory
management was not the primary bottleneck in this job.
Basho LevelDB
| Threads | Run Time | CPU % | DB Size | Process Size | Total Size | Context Switches | Write Rate | Read Rate | |||
|---|---|---|---|---|---|---|---|---|---|---|---|
| Wall | User | Sys | Vol | Invol | |||||||
| 1 | 10:05.90 | 00:13:16.31 | 00:00:58.51 | 141 | 22235100 | 124040 | 22359140 | 4559899 | 3329 | 28537 | 136224 |
| 2 | 15:44.78 | 00:05:59.99 | 00:01:56.32 | 50 | 14100716 | 1202292 | 15303008 | 4622960 | 13638 | 28812 | 98 |
| 4 | 15:31.54 | 00:06:48.86 | 00:02:38.56 | 60 | 14234156 | 2375352 | 16609508 | 4870339 | 10488 | 29589 | 191 |
| 8 | 15:09.44 | 00:18:35.88 | 00:04:54.15 | 155 | 14305968 | 5160364 | 19466332 | 5162992 | 11481 | 29418 | 123062 |
| 16 | 15:13.75 | 00:23:54.79 | 00:07:06.73 | 203 | 14282368 | 7736848 | 22019216 | 5072717 | 15657 | 28115 | 116180 |
| 32 | 14:57.63 | 01:21:59.45 | 00:13:13.57 | 636 | 24189220 | 16038284 | 40227504 | 5495729 | 94342 | 28181 | 92840 |
| 64 | 14:21.45 | 03:28:59.50 | 00:15:48.99 | 1565 | 13792880 | 19680608 | 33473488 | 4719323 | 126089 | 23955 | 81127 |
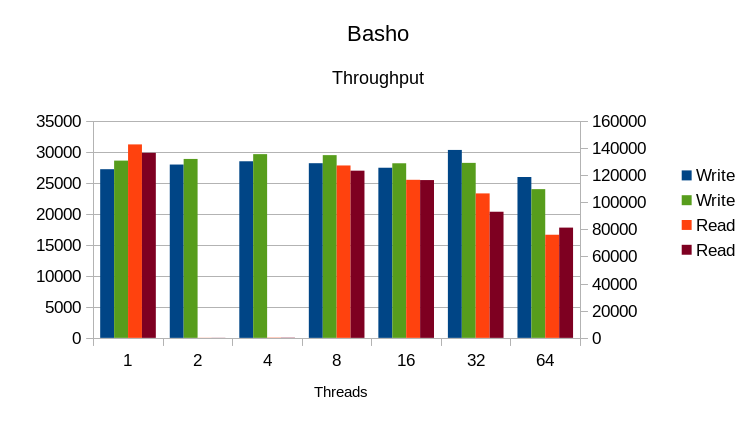
Interleaving has very little effect on this engine. There is a small improvement in
write speed and a small decline in read speed. The difference is negligible.
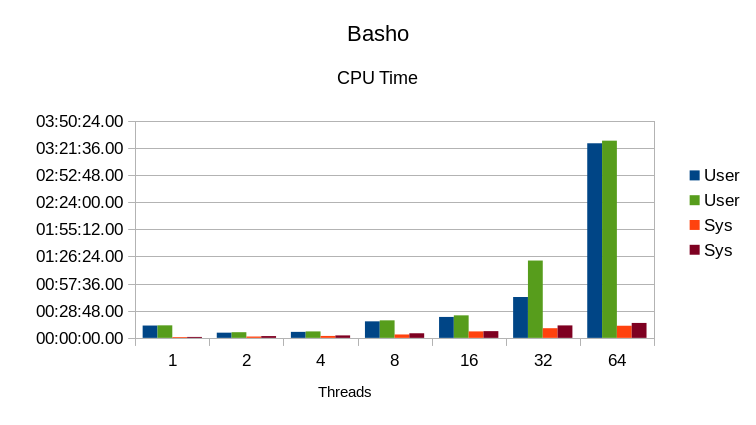
There is a very small difference in CPU usage as well. Again, negligible.
The jump in User CPU at 32 threads is unexplained; since neither write nor
read rate improved it must be attributed to miscellaneous background threads.
BerkeleyDB
| Threads | Run Time | CPU % | DB Size | Process Size | Total Size | Context Switches | Write Rate | Read Rate | |||
|---|---|---|---|---|---|---|---|---|---|---|---|
| Wall | User | Sys | Vol | Invol | |||||||
| 1 | 10:56.27 | 00:09:04.06 | 00:01:49.57 | 99 | 35009336 | 16072924 | 51082260 | 514088 | 2381 | 3115 | 47439 |
| 2 | 10:21.08 | 00:19:02.87 | 00:03:54.69 | 221 | 34956112 | 16087560 | 51043672 | 4640838 | 2046 | 4246 | 63447 |
| 4 | 10:46.36 | 00:30:21.28 | 00:12:05.09 | 393 | 34935936 | 16085864 | 51021800 | 37867420 | 1267 | 4203 | 72870 |
| 8 | 10:40.53 | 00:32:55.82 | 00:44:29.80 | 725 | 34962656 | 16079060 | 51041716 | 87209386 | 1972 | 3672 | 69837 |
| 16 | 10:26.87 | 00:24:52.34 | 02:19:37.21 | 1574 | 34950420 | 16070612 | 51021032 | 21425278 | 3864 | 2376 | 63458 |
| 32 | 10:07.14 | 00:22:53.33 | 05:02:50.08 | 3218 | 34934484 | 16065592 | 51000076 | 9157273 | 178452 | 1133 | 52399 |
| 64 | 10:07.63 | 00:34:59.03 | 09:50:49.81 | 6179 | 34934968 | 16059664 | 50994632 | 11528352 | 56269 | 459 | 34243 |
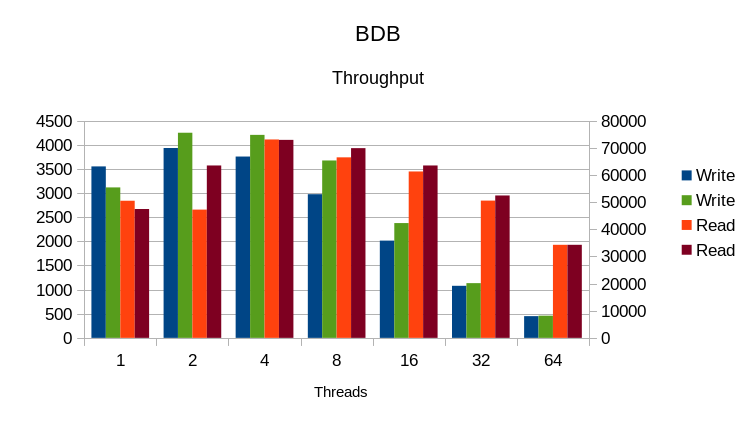
There are some slight improvements from 2-32 threads. The lock scaling issues still override
everything else.
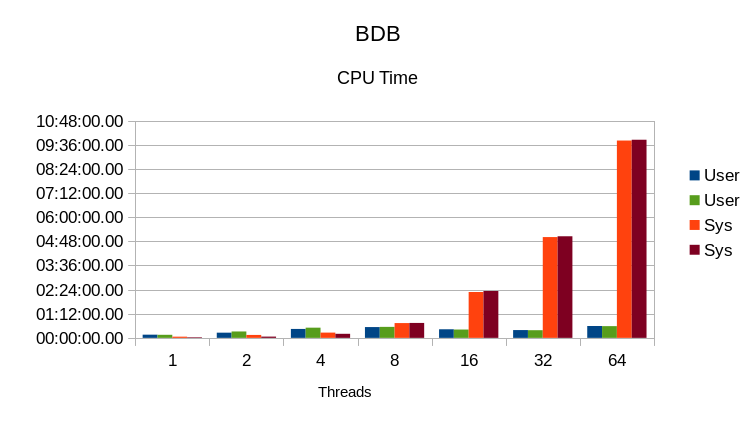
The CPU usage is about the same as before. Again, NUMA memory management is not
the main concurrency problem in BDB.
HyperLevelDB
| Threads | Run Time | CPU % | DB Size | Process Size | Total Size | Context Switches | Write Rate | Read Rate | |||
|---|---|---|---|---|---|---|---|---|---|---|---|
| Wall | User | Sys | Vol | Invol | |||||||
| 1 | 10:28.80 | 00:14:57.29 | 00:01:13.33 | 154 | 15492212 | 14296644 | 29788856 | 308039 | 2258 | 55534 | 16202 |
| 2 | 10:30.20 | 00:20:36.89 | 00:01:24.85 | 209 | 17453188 | 16319164 | 33772352 | 2997019 | 3074 | 36535 | 22183 |
| 4 | 10:23.14 | 00:34:47.22 | 00:02:16.15 | 356 | 16713864 | 16899204 | 33613068 | 5281586 | 1784 | 35247 | 49710 |
| 8 | 10:37.85 | 00:57:18.79 | 00:05:30.97 | 591 | 17573584 | 16835240 | 34408824 | 16387262 | 1917 | 35632 | 78992 |
| 16 | 10:41.45 | 01:21:08.98 | 00:54:49.57 | 1271 | 15426096 | 17333076 | 32759172 | 60827685 | 2983 | 21481 | 154460 |
| 32 | 11:07.84 | 01:06:45.44 | 04:19:34.30 | 2931 | 15130044 | 15566016 | 30696060 | 8263327 | 271542 | 5414 | 172839 |
| 64 | 10:31.53 | 01:12:39.97 | 09:14:55.41 | 5962 | 14226732 | 14625920 | 28852652 | 6220146 | 71491 | 1665 | 117118 |
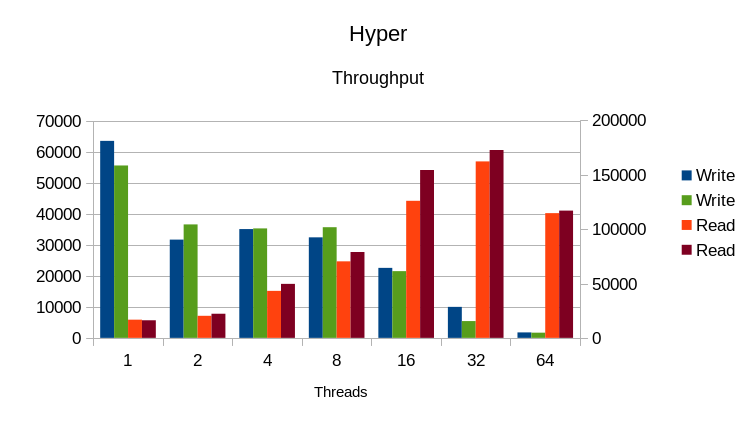
Writes are a mixed bag here, but reads show slight improvement for 2-64 threads.
Memory Interleaving definitely has a beneficial effect overall.
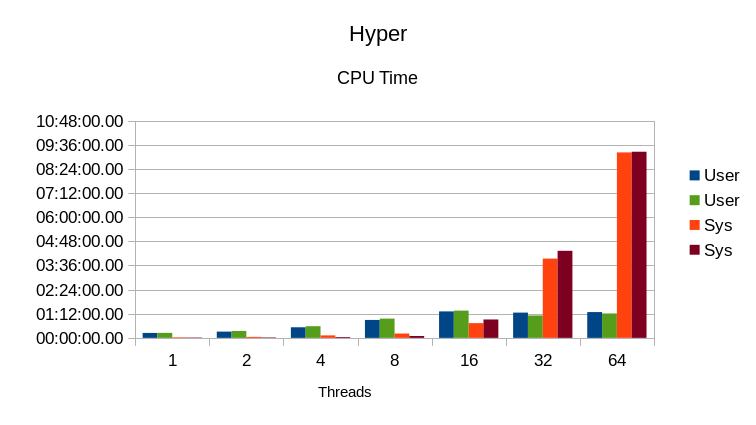
At 2-16 threads the User CPU time increases, as does overall throughput. From 32
threads read throughput has still increased but write throughput has correspondingly
decreased, and User CPU time decreases overall. From 32-64 threads the System CPU
usage still dominates.
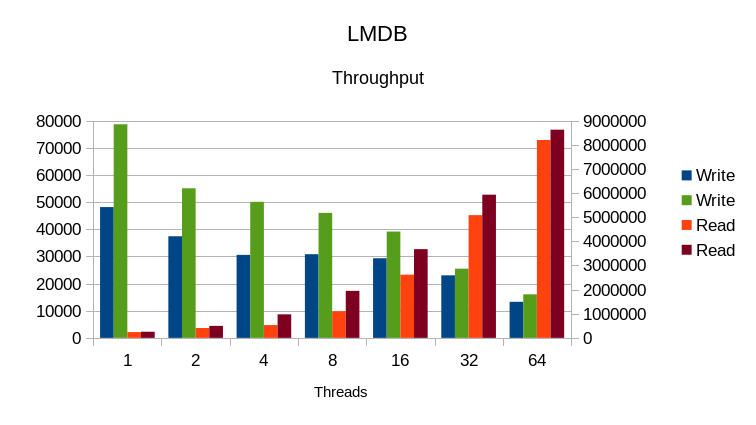
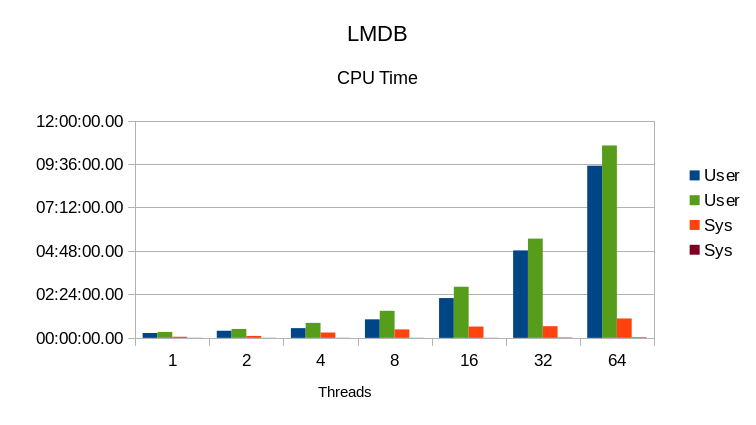
LMDB
| Threads | Run Time | CPU % | DB Size | Process Size | Total Size | Context Switches | Write Rate | Read Rate | |||
|---|---|---|---|---|---|---|---|---|---|---|---|
| Wall | User | Sys | Vol | Invol | |||||||
| 1 | 10:02.16 | 00:19:33.07 | 00:00:27.88 | 199 | 12581296 | 12583860 | 12583860 | 28 | 1559 | 66783 | 245876 |
| 2 | 10:01.35 | 00:29:36.85 | 00:00:22.70 | 299 | 12583952 | 12586532 | 12586532 | 62 | 2816 | 50205 | 492097 |
| 4 | 10:01.32 | 00:49:27.01 | 00:00:31.28 | 498 | 12583952 | 12586552 | 12586552 | 120 | 3942 | 42977 | 979044 |
| 8 | 10:01.33 | 01:29:25.67 | 00:00:30.25 | 897 | 12584440 | 12587092 | 12587092 | 238 | 6870 | 41000 | 1904389 |
| 16 | 10:01.32 | 02:49:11.75 | 00:00:39.18 | 1694 | 12586408 | 12589368 | 12589368 | 467 | 22243 | 32598 | 3607440 |
| 32 | 10:01.23 | 05:28:42.80 | 00:00:55.00 | 3289 | 12586408 | 12589564 | 12589564 | 966 | 213596 | 23274 | 5733411 |
| 64 | 10:01.35 | 10:35:17.47 | 00:01:46.09 | 6356 | 12636172 | 12640236 | 12640236 | 1720 | 156836 | 14589 | 8544139 |
The CPU use here is even closer to the ideal 200 / 300 / 500 / 900 / 1700 / 3300 / 6400.
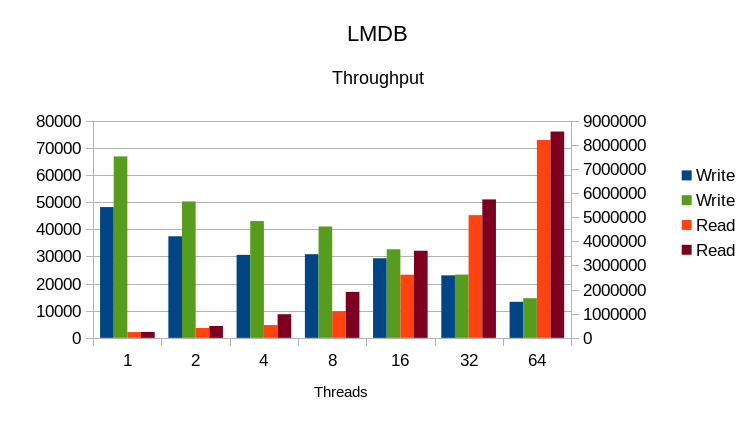
The write and read rates both improve at all load levels. With all other overheads
removed the NUMA memory layout was the only remaining bottleneck.

The User CPU time increases since more useful work is being done. The System CPU time
disappears once the NUMA overhead is removed. The increase in User CPU time is just
about equal to the decrease in System CPU time, which indicates that there is no other
overhead in this engine. All of the CPU time is dedicated to getting useful work done.
RocksDB
This is using RocksDB's default settings, except that the cache size was set to 32GB
and the write buffer size was set to 256MB.
| Threads | Run Time | CPU % | DB Size | Process Size | Total Size | Context Switches | Write Rate | Read Rate | |||
|---|---|---|---|---|---|---|---|---|---|---|---|
| Wall | User | Sys | Vol | Invol | |||||||
| 1 | 10:08.61 | 00:15:11.86 | 00:01:17.58 | 162 | 13336168 | 361268 | 13697436 | 225728 | 2041 | 32849 | 252517 |
| 2 | 10:22.55 | 00:23:31.98 | 00:02:29.95 | 250 | 14861368 | 21030876 | 35892244 | 1811398 | 1846 | 28768 | 31469 |
| 4 | 10:36.46 | 00:41:12.95 | 00:04:02.82 | 426 | 15379496 | 23023440 | 38402936 | 11283437 | 2477 | 29197 | 48566 |
| 8 | 10:44.51 | 01:13:29.93 | 00:08:43.80 | 765 | 15417948 | 24022784 | 39440732 | 43387734 | 2361 | 28897 | 234916 |
| 16 | 10:22.52 | 02:02:28.26 | 00:27:36.12 | 1446 | 15535708 | 24261388 | 39797096 | 144187254 | 3921 | 30994 | 265369 |
| 32 | 10:43.64 | 01:48:50.62 | 03:12:39.32 | 2810 | 15410800 | 24038448 | 39449248 | 116177758 | 114539 | 28839 | 131353 |
| 64 | 10:49.13 | 02:26:06.91 | 06:47:53.79 | 5120 | 15162408 | 23152968 | 38315376 | 59688289 | 50858 | 23142 | 112042 |
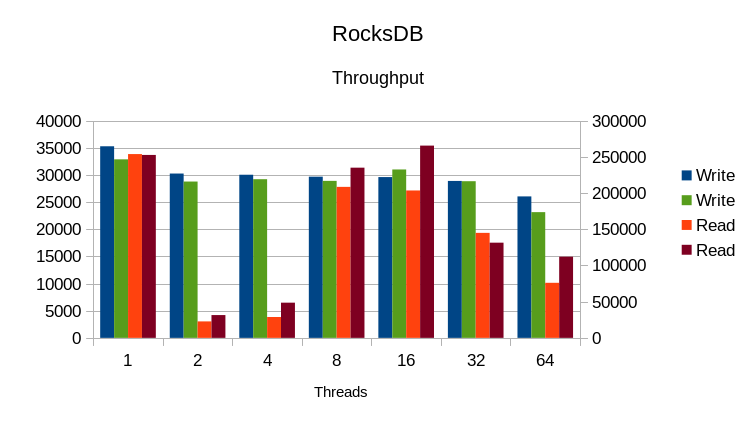
Again a mixed bag for writes but mostly showing a slight decrease in throughput.
Reads increase from 2-16 threads, along with a sizable increase at 64 threads.
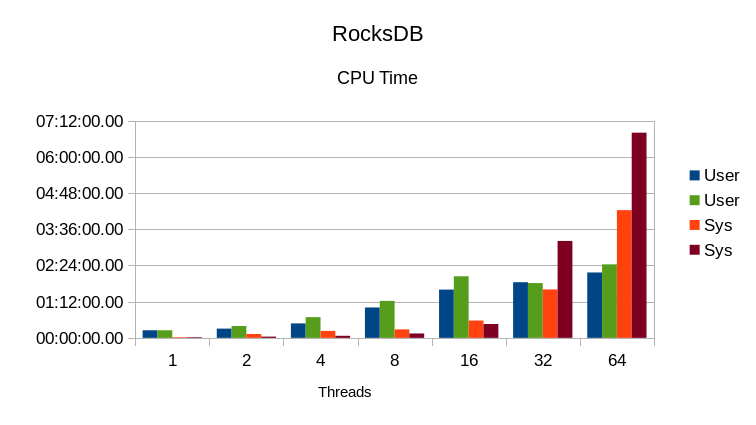
User CPU increased and system CPU decreased from 2-16 threads, corresponding to
increased throughput at those loads. System CPU increased drastically from 32-64
threads, and overall throughput is lower at those loads. NUMA Interleave
definitely had an effect, just not always a positive one.
RocksDBpfx
This is using all of the tuning settings as published in the original RocksDB
in-memory benchmark.
| Threads | Run Time | CPU % | DB Size | Process Size | Total Size | Context Switches | Write Rate | Read Rate | |||
|---|---|---|---|---|---|---|---|---|---|---|---|
| Wall | User | Sys | Vol | Invol | |||||||
| 1 | 11:22.02 | 00:16:00.28 | 00:01:12.82 | 151 | 13928896 | 18403556 | 32332452 | 1205929 | 1732 | 28800 | 146722 |
| 2 | 11:39.09 | 00:26:39.78 | 00:01:17.60 | 239 | 14194132 | 20725632 | 34919764 | 1515646 | 2776 | 23797 | 316705 |
| 4 | 11:53.16 | 00:47:39.38 | 00:01:29.42 | 413 | 14265424 | 21879872 | 36145296 | 1591694 | 4790 | 28485 | 585065 |
| 8 | 11:43.35 | 01:27:36.00 | 00:01:30.34 | 760 | 14313808 | 21649184 | 35962992 | 1397393 | 9526 | 28963 | 1189949 |
| 16 | 11:59.31 | 02:47:36.37 | 00:01:31.85 | 1410 | 14214584 | 21239832 | 35454416 | 1493196 | 64616 | 26009 | 2366738 |
| 32 | 11:44.16 | 05:28:24.44 | 00:01:39.57 | 2812 | 14352108 | 21201484 | 35553592 | 1325322 | 286111 | 28620 | 4559325 |
| 64 | 11:48.04 | 10:37:49.52 | 00:01:33.31 | 5418 | 13924948 | 21562912 | 35487860 | 67428 | 177861 | 20717 | 8487500 |
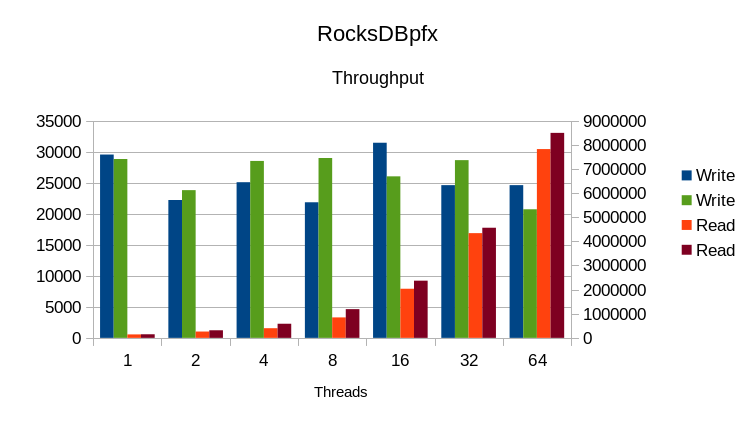
The write rates are too erratic to judge, but the read rates generally
improve.
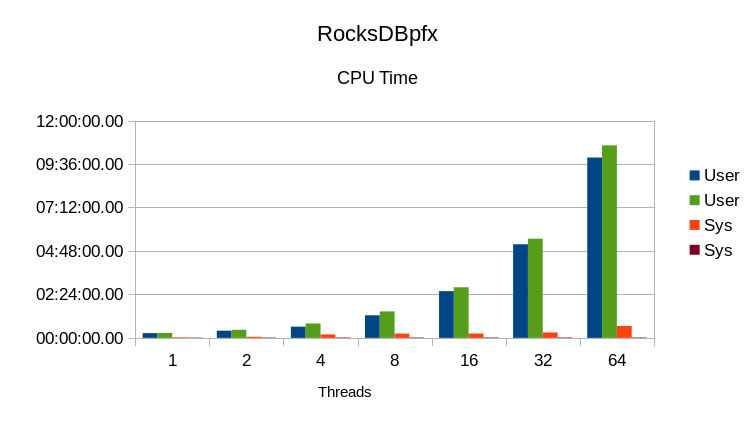
The User CPU time increases with the increased throughput, and System CPU
time disappears. NUMA Interleave clearly was a significant factor here.
TokuDB
| Threads | Run Time | CPU % | DB Size | Process Size | Total Size | Context Switches | Write Rate | Read Rate | |||
|---|---|---|---|---|---|---|---|---|---|---|---|
| Wall | User | Sys | Vol | Invol | |||||||
| 1 | 10:05.31 | 00:09:50.90 | 00:00:35.44 | 103 | 12393604 | 13927616 | 26321220 | 601745 | 1321 | 267 | 65927 |
| 2 | 10:05.95 | 00:19:08.28 | 00:01:06.61 | 200 | 12489916 | 14232468 | 26722384 | 2967389 | 609 | 254 | 112733 |
| 4 | 10:05.88 | 00:29:15.75 | 00:06:15.85 | 351 | 12603924 | 14553060 | 27156984 | 43109562 | 709 | 249 | 134821 |
| 8 | 10:07.81 | 00:34:44.14 | 00:25:27.36 | 594 | 12699920 | 14803268 | 27503188 | 116809867 | 1211 | 234 | 132296 |
| 16 | 10:06.84 | 00:23:50.51 | 02:08:15.03 | 1503 | 12830940 | 15004280 | 27835220 | 44295237 | 3832 | 233 | 96566 |
| 32 | 10:08.08 | 00:20:53.26 | 04:51:15.85 | 3080 | 12924644 | 15059552 | 27984196 | 15668102 | 145280 | 202 | 71258 |
| 64 | 10:07.70 | 00:30:38.67 | 09:30:34.30 | 5935 | 12927752 | 15089528 | 28017280 | 14636953 | 94748 | 114 | 46452 |
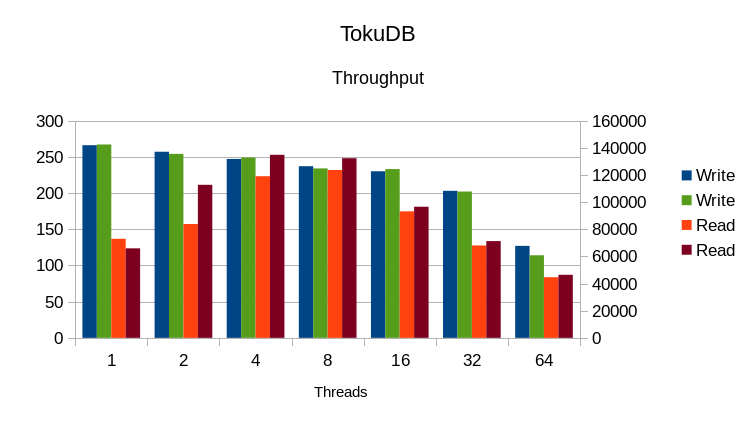
Write speeds are largely unaffected. Read speeds improve slightly from 2-64 threads.
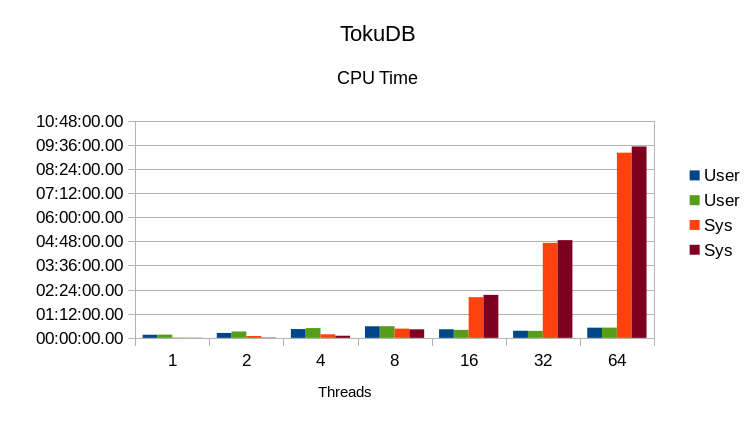
System CPU time increases, indicating that removing the NUMA bottleneck exposed another
bottleneck.
WiredTiger LSM
| Threads | Run Time | CPU % | DB Size | Process Size | Total Size | Context Switches | Write Rate | Read Rate | |||
|---|---|---|---|---|---|---|---|---|---|---|---|
| Wall | User | Sys | Vol | Invol | |||||||
| 1 | 10:03.65 | 00:21:07.42 | 00:03:11.40 | 241 | 12727596 | 13239680 | 25967276 | 191759 | 2254 | 761 | 32522 |
| 2 | 10:04.29 | 00:30:40.19 | 00:00:29.08 | 309 | 12879060 | 13268204 | 26147264 | 130571 | 2586 | 2300 | 87642 |
| 4 | 10:03.96 | 00:50:24.42 | 00:00:42.72 | 507 | 12989428 | 13476972 | 26466400 | 308552 | 4285 | 2517 | 168633 |
| 8 | 10:03.95 | 01:29:40.70 | 00:00:18.44 | 893 | 13128856 | 13454148 | 26583004 | 698836 | 8203 | 2091 | 287831 |
| 16 | 10:03.93 | 02:41:36.81 | 00:07:49.91 | 1683 | 13251660 | 13591580 | 26843240 | 1416797 | 62008 | 1704 | 389677 |
| 32 | 10:04.01 | 05:23:10.76 | 00:02:48.69 | 3238 | 13210316 | 13544348 | 26754664 | 2881576 | 310655 | 1001 | 314734 |
| 64 | 10:04.26 | 10:04:29.74 | 00:10:42.43 | 6108 | 13244864 | 13581452 | 26826316 | 4327309 | 756290 | 480 | 313502 |
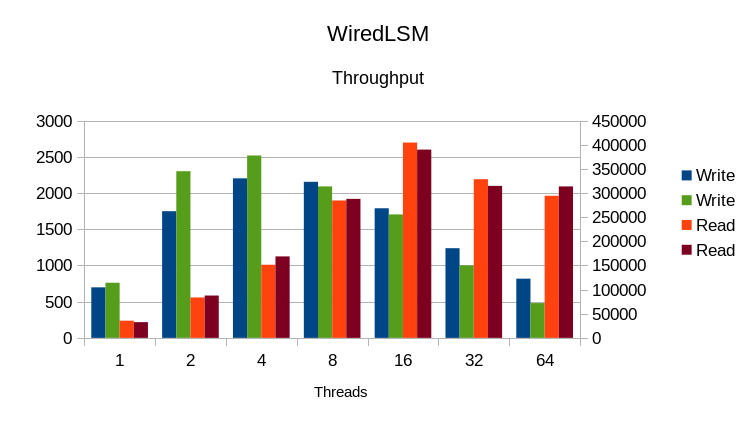
Write rates improved from 1-4 threads but declined after that. Read
reates improved minimally from 2-8 threads, and also a small bump at 64
threads. The overall effect is small.
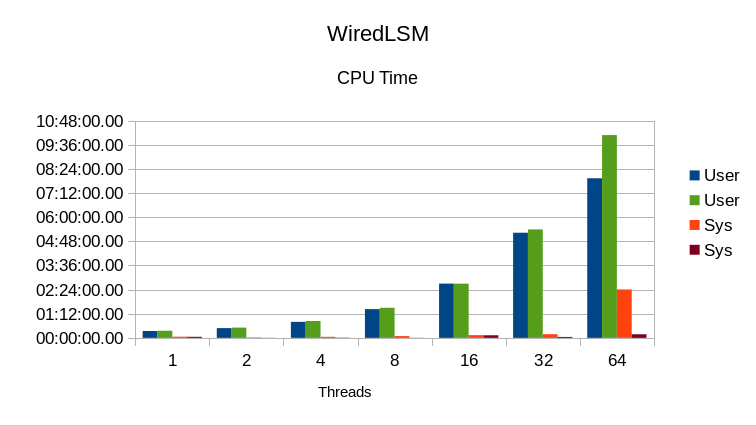
System CPU use was generally small to begin with. Given the high NUMA
overheads seen in other engines that suggests that WiredTiger already does
some NUMA-aware memory management of its own. Still, the increases in
User CPU time don't translate into higher throughput; it appears to be
absorbed in their user-level lock manager instead.
WiredTiger Btree
| Threads | Run Time | CPU % | DB Size | Process Size | Total Size | Context Switches | Write Rate | Read Rate | |||
|---|---|---|---|---|---|---|---|---|---|---|---|
| Wall | User | Sys | KB | KB | Vol | Invol | |||||
| 1 | 15:58.84 | 00:35:20.18 | 00:00:57.05 | 132 | 23818836 | 18958056 | 42776892 | 516444 | 1597 | 37222 | 162604 |
| 2 | 13:11.43 | 00:30:00.82 | 00:00:54.58 | 234 | 23818844 | 19358404 | 43177248 | 943475 | 2370 | 37964 | 309617 |
| 4 | 12:22.58 | 00:49:40.99 | 00:00:55.87 | 408 | 23818844 | 19496644 | 43315488 | 1704808 | 4111 | 36847 | 586944 |
| 8 | 12:13.40 | 01:28:44.97 | 00:01:05.87 | 735 | 23818844 | 19031384 | 42850228 | 2380102 | 9520 | 29609 | 720310 |
| 16 | 12:08.71 | 02:46:12.44 | 00:01:27.17 | 1380 | 23818844 | 18282632 | 42101476 | 3086203 | 218094 | 19332 | 962731 |
| 32 | 12:08.59 | 05:17:23.53 | 00:03:03.54 | 2638 | 23818836 | 17883816 | 41702652 | 4303352 | 317187 | 13774 | 857231 |
| 64 | 12:15.33 | 10:02:15.45 | 00:06:21.70 | 4966 | 23818836 | 17144816 | 40963652 | 4722472 | 866592 | 5004 | 854094 |
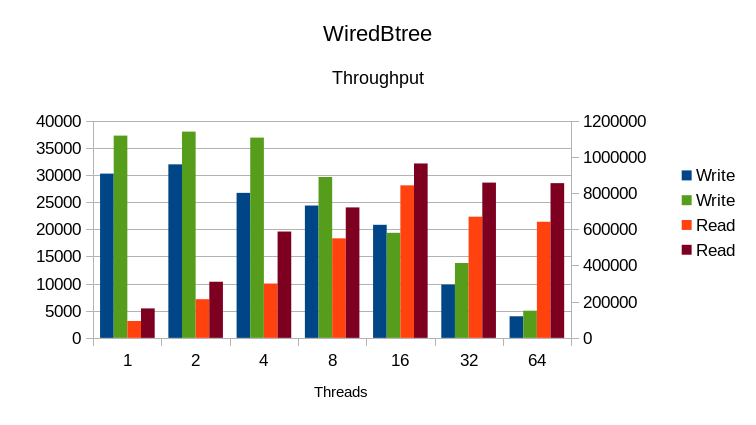
Reads improve at all load levels. Writes improve at all loads except the 16
thread case.
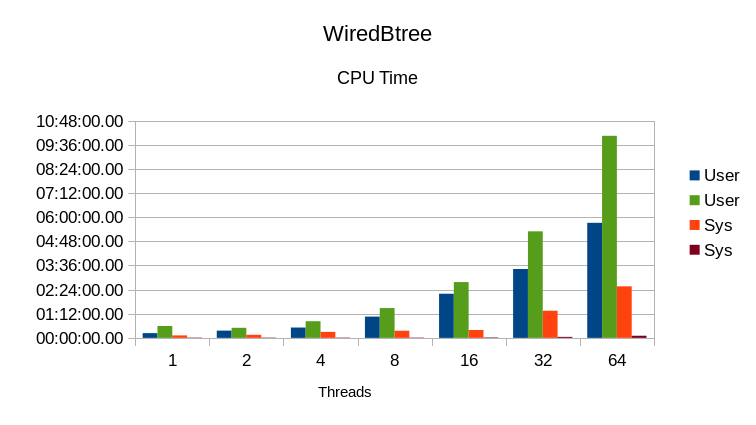
The System CPU time mostly disappears. User CPU time increases by a larger
amount than the removed System CPU time; overall CPU utilization is higher
than in the original test but there's still significant I/O wait involved.
The software versions we used:
Software revisions used:

violino:/home/software/leveldb> g++ --version
g++ (Ubuntu 4.8.2-19ubuntu1) 4.8.2
Copyright (C) 2013 Free Software Foundation, Inc.
This is free software; see the source for copying conditions.  There is NO
warranty; not even for MERCHANTABILITY or FITNESS FOR A PARTICULAR PURPOSE.

violino:/home/software/leveldb> git log -1 --pretty=format:"%H %ci" master
e353fbc7ea81f12a5694991b708f8f45343594b1 2014-05-01 13:44:03 -0700

violino:/home/software/basho_leveldb> git log -1 --pretty=format:"%H %ci" develop
d1a95db0418d4e17223504849b9823bba160dfaa 2014-08-21 15:41:50 -0400

violino:/home/software/db-5.3.21> ls -l README
-rw-r--r-- 1 hyc hyc 234 May 11  2012 README

violino:/home/software/HyperLevelDB> git log -1 --pretty=format:"%H %ci" master
02ad33ccecc762fc611cc47b26a51bf8e023b92e 2014-08-20 16:44:03 -0400

violino:~/OD/mdb> git log -1 --pretty=format:"%H %ci"
a054a194e8a0aadfac138fa441c8f67f5d7caa35 2014-08-24 21:18:03 +0100

violino:/home/software/rocksdb> git log -1 --pretty=format:"%H %ci"
7e9f28cb232248b58f22545733169137a907a97f 2014-08-29 21:21:49 -0700

violino:/home/software/ft-index> git log -1 --pretty=format:"%H %ci" master
f17aaee73d14948962cc5dea7713d95800399e65 2014-08-30 06:35:59 -0400

violino:/home/software/wiredtiger> git log -1 --pretty=format:"%H %ci"
1831ce607baf61939ddede382ee27e193fa1bbef 2014-08-14 12:31:38 +1000
All of the engines were built with compression disabled; compression was not used in the RocksDB test either. Some of these engines recommend/require use of a non-standard malloc library like Google tcmalloc or jemalloc. To ensure as uniform a test as possible, all of the engines in this test were built to use the standard libc malloc.


| Threads | Run Time | CPU % | DB Size | Process Size | Total Size | Context Switches | Write Rate | Read Rate | |||
|---|---|---|---|---|---|---|---|---|---|---|---|
| Wall | User | Sys | Vol | Invol | |||||||
| 1 | 10:02.19 | 00:19:40.29 | 00:00:20.70 | 199 | 12582308 | 12584884 | 12584884 | 28 | 1552 | 78592 | 255009 |
| 2 | 10:01.42 | 00:29:31.88 | 00:00:27.74 | 299 | 12582852 | 12585436 | 12585436 | 51 | 2345 | 55064 | 497413 |
| 4 | 10:01.36 | 00:49:37.84 | 00:00:20.53 | 498 | 12582852 | 12585456 | 12585456 | 106 | 3791 | 50099 | 972695 |
| 8 | 10:01.38 | 01:29:34.11 | 00:00:21.81 | 897 | 12583424 | 12586080 | 12586080 | 182 | 6877 | 46000 | 1946509 |
| 16 | 10:01.38 | 02:49:22.59 | 00:00:28.17 | 1694 | 12584968 | 12587932 | 12587932 | 442 | 73179 | 39125 | 3671094 |
| 32 | 10:01.36 | 05:28:33.32 | 00:01:05.36 | 3288 | 12593160 | 12596320 | 12596320 | 1127 | 89384 | 25450 | 5929076 |
| 64 | 10:01.36 | 10:37:16.71 | 00:01:41.25 | 6375 | 12599308 | 12603380 | 12603380 | 2183 | 127897 | 16019 | 8621229 |
This used revision
violino:~/OD/mdb> git log -1 --pretty=format:"%H %ci"
3646ba966c75137b01e38fc5baea6d5864189c8e 2014-09-09 19:44:23 +0100
The raw output and updated binary are also available.